Yield Curve Inversion Ahead
Posted On Thursday, Mar 23, 2023
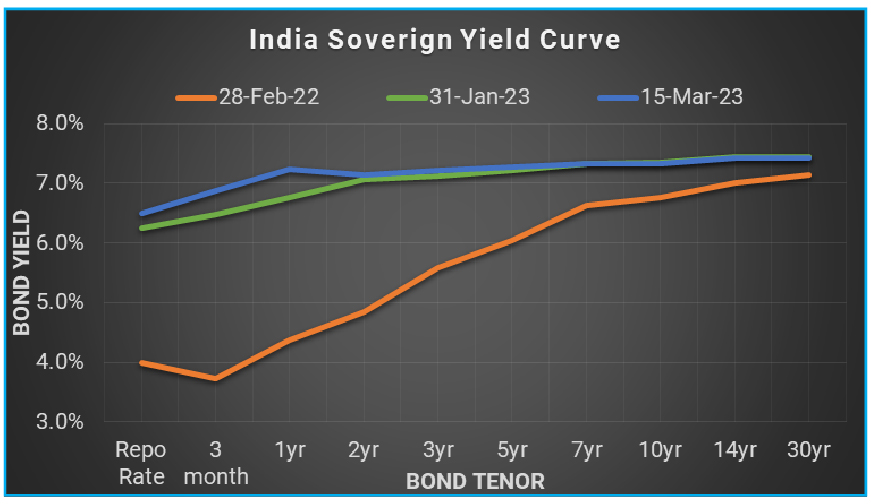
Indian money markets have tightened meaningfully over the last one and a half month. Interest rates on the short-term debt instruments like treasury bills, commercial papers, certificate of deposits, etc. shot up by 50-70 basis points (100 basis points = 1%) since the start of February 2023. While longer term bond yields moved up only marginally by 3-6 basis points.
Table – I: Short-term yields moved up more than Longer term yields.
Tenor | Yield as of... | Change in Yield in basis Points | |||
| Mar 14, 2023 | Jan 31, 2023 | Feb 28, 2022 | Since Jan 31, 2023 | Since Feb 28, 2022 | |
3 months T-bill | 6.87 | 6.48 | 3.73 | 42 | 317 |
1 year T-bill | 7.23 | 6.77 | 4.38 | 50 | 289 |
5-year G-sec | 7.28 | 7.22 | 6.05 | 6 | 123 |
10-year G-sec | 7.34 | 7.34 | 6.77 | 3 | 60 |
Source – Refinitiv, Quantum Research, Data as of March 15, 2023
Past Performance may or may not sustain in the future.
Short-term yields have been rising at a faster pace than longer-term yields for the last 12 months. RBI’s tightening measures – rate hikes and liquidity reduction, had a greater impact on the short end of the rate curve. As a result, the yield curve (a plot of yield for various maturities of bonds) flattened.
Chart – I: Rapid rate hikes and liquidity tightening flattened the yield curve
Source – Refinitiv, Quantum Research, Data as of March 15, 2023 | Past Performance may or may not sustain in future.
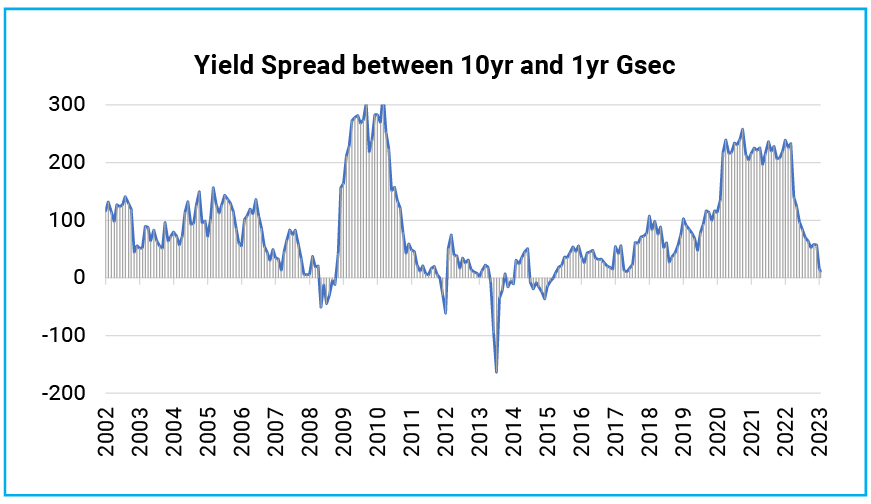
As per market convention, the yield curve shape is measured as the gap between long term interest rates and short-term interest rates. Based on the yield gap between the 10-year Gsec and 1 year Treasury bill, the Indian yield curve has flattened by 46 basis points since January 31, 2023, and by 228 basis points since February 28, 2022.
Currently, the gap the 10-year Gsec and the 1-year treasury bill is at its lowest point in 6 years at 11 basis points.
Chart – II: India sovereign yield curve flattest since 2015
Source – Refinitiv, Quantum Research, Data as of March 15, 2023 | Past Performance may or may not sustain in future.
What does it mean?
“A yield curve is a tool that helps you understand bond markets, interest rates and the health of the economy as a whole.” – Forbes
A normal yield curve is considered to be upward sloping with longer tenor bonds yielding higher than shorter tenor bonds. Investors typically assume lower risk in shorter tenor bonds, thus settling for lower interest.
However, the yield curve often flattens, or inverts, based on markets’ expectations of future growth and inflation. Historically, the yield curve had flattened or inverted at the peak of monetary policy tightening or before the start of the rate cutting cycle. Investors typically buy longer-term bonds when they expect interest rates to remain stable or decline in future.
Like many times in the past, the flat yield curve, this time, is also a result of steep rate hike and liquidity tightening by the RBI. Since February last year, the RBI has hiked the repo rate by 250 basis points and has reduced the core liquidity surplus by more than Rs. 8 trillion. The flat yield curve is a signal that the current monetary tightening cycle is at or near the peak.
What is ahead?
As we wrote in the January 2023 edition of the debt market observer refer Positioning for Disinflation, a significant disinflation is already underway, and the economic growth momentum is fading. Thus, we would like to see the RBI pausing the rate hiking cycle and waiting for past rate hikes to work through the economy.
However, given the hawkish commentary of the RBI in the last meeting, we might see another rate hike of 25 basis points in April. Even so, a June rate hike can’t be ruled out.
In our view, further rate hikes will make financial conditions restrictive and will be obstructive to economic growth which is already losing momentum.
Thus, rate hikes now will bring forward the timeline of rate cuts in future and will not have any material impact on long-term bond yields. which typically focus on medium term growth and inflation dynamics. While short-term yields will likely move higher.
Short term yields will also face upward pressure from declining liquidity and increasing demand for funds from banks to support over 15% credit growth.
Thus, we would expect the yield curve to invert with further rate hikes. The yield spread between the 10-year Gsec and 1 year treasury bill could dip to -20 to -30 basis points if repo rate goes to 7%.
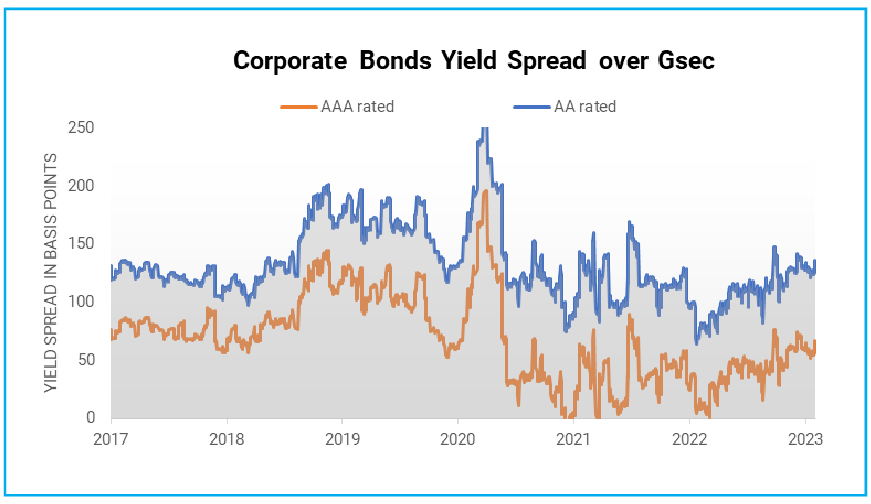
Tightening liquidity and a flat/inverted yield curve will also exert pressure on credit spreads. We expect bond yields to move higher compared to the respective maturity government bonds, thus, widening the credit spreads.
Banks typically raise short-term deposits. Thus, elevated short term rates will reduce banks’ interest margins and will result in further increase in lending rates.
Chart – III: Credit Spreads to widen on tightening liquidity condition and flat yield curve
Source – Bloomberg, Quantum Research, Data as of March 15, 2023 | Past Performance may or may not sustain in future.
What should Investors do?
Higher starting yields auger well for fixed income returns. With most of the government bond yield curve above 7.25%, the accrual yield has improved significantly in the bond market. Also, there is room opening for capital appreciation over a medium-term horizon.
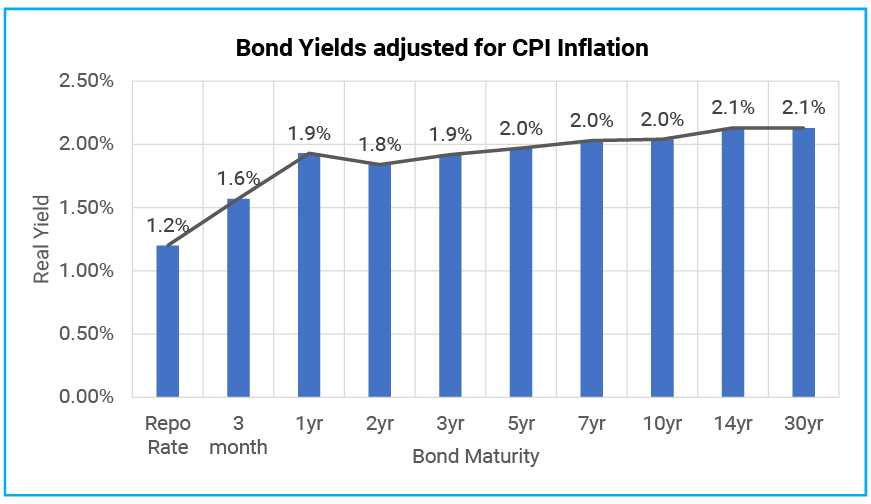
Even in real terms,(adjusted for inflation), government bonds are now offering a meaningful positive real yield. With expected CPI inflation of 5.3% (RBI’s FY24 inflation estimate) and the 1-year Gsec yield at 7.3%, the real yield is around 200 basis points.
Chart – IV: The real rate is positive across the yield curve
Source – Refinitiv, Quantum Research, Data as of March 15, 2023 | # Real rates are based on the RBI’s FY24 average CPI inflation estimate of 5.3%. | Past Performance may or may not sustain in the future.
All in all, the return potential of fixed-income funds has improved, and the next three years are likely to be more rewarding for fixed-income investors than what we witnessed in the last three years.
We suggest investors with a 2-3 years holding period should consider adding their allocation to dynamic bond funds.
Dynamic bond funds have the flexibility to change the portfolio positioning as per the evolving market conditions. This makes dynamic bond funds better suited for long-term investors in this volatile macro environment than other long-term bond fund categories.
A Dynamic Bond Fund or any other debt fund which invests in long-term debt instruments are highly sensitive to interest rate movements. Thus, in a short period of time, returns could be highly volatile and can even be negative. However, over a longer time frame of over 2-3 years period, returns tend to normalize along with the interest rate cycles.
Chart-V: Bond Fund Investments require a longer holding period
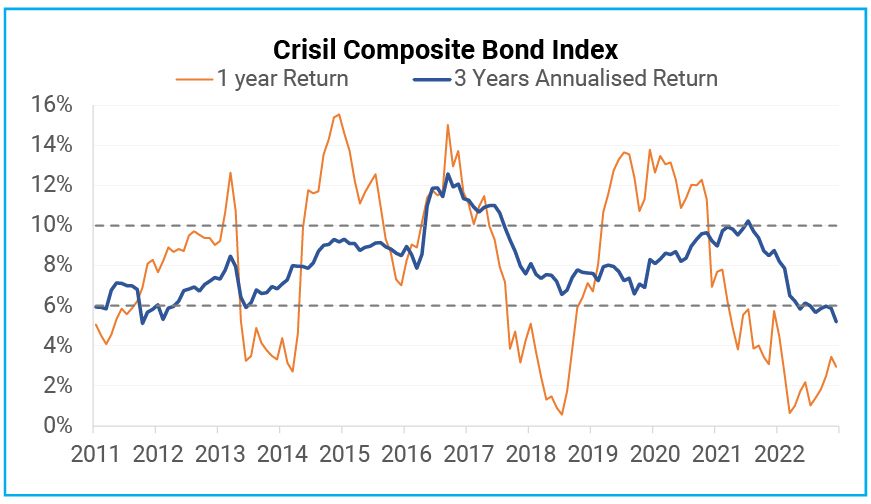
Source – AMFI Portal, Crisil, Quantum Research; Data as of February 28, 2023 | Past Performance may or may not sustain in future.
Investors with shorter investment horizons and low-risk appetite should stick with liquid funds. With the increase in short-term interest rates, we should expect further improvement in potential returns from investments in liquid going forward.
Since the interest rate on bank savings accounts is not likely to increase quickly while the returns from the liquid fund are already seeing an increase, investing in liquid funds looks more attractive for your surplus funds.
Chart – VI: Liquid Fund Yields Moved up Tracking Treasury Bill Rate
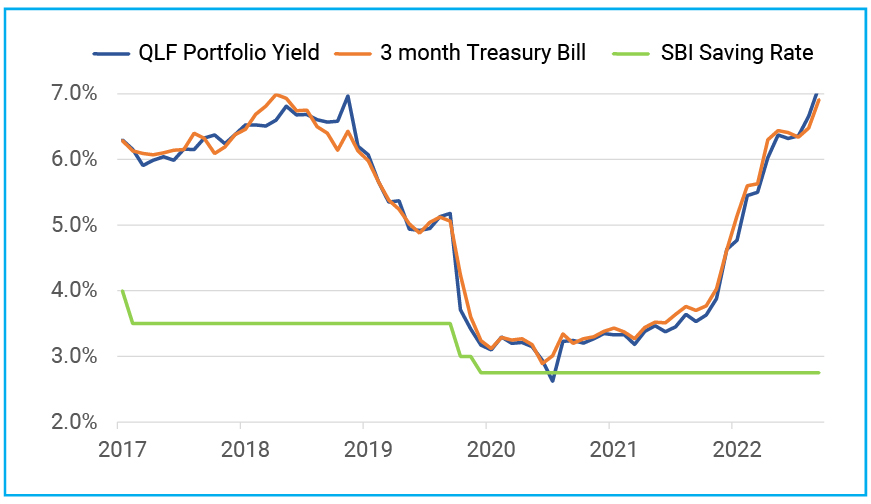
Source – Refinitiv, Quantum Research; Data as of February 28, 2023 | Past Performance may or may not sustain in future.
Investors with a short-term investment horizon and with little desire to take risks should invest in liquid funds which own government securities and do not invest in private sector companies which carry lower liquidity and higher risk of capital loss in case of default.
Portfolio Positioning
Scheme Name | Strategy |
The scheme continues to invest in debt securities of up to 91 days of maturity issued by the government and selected public sector companies. | |
The scheme continues to invest in debt securities issued by the government and selected public sector companies. The scheme follows an active duration management strategy and increases/decreases the portfolio’s sensitivity to interest rates in line with the Interest Rate outlook. The QDBF portfolio is currently positioned as a barbell with heavy allocation to the 2-year and 10-year segments which reflects a good mix of high accruals and the potential for capital appreciation if bond yields fall. We remain positive from a medium-term perspective. |
For any queries directly linked to the insights and data shared in the newsletter, please reach out to the author – Pankaj Pathak, Fund Manager – Fixed Income at [email protected].
For all other queries, please contact Neeraj Kotian – Area Manager, Quantum AMC at [email protected] / [email protected] or call him on Tel: 9833289034
Read our last few Debt Market Observer write-ups -
- Past, Present, and Future of Inflation
- Positioning for Disinflation
Portfolio Information Scheme Name: Quantum Liquid Fund | |
| Description (if any) | |
Annualised Portfolio YTM*: | 7.11% |
Macaulay Duration | 47 days |
Residual Maturity | 47 days |
As on (Date) | 28-02-2023 |
*in case of semi annual YTM, it will be annualised
Name of the Scheme | This product is suitable for investors who are seeking* | Riskometer |
Quantum Liquid Fund An Open-ended Liquid Scheme. A relatively low interest rate risk and relatively low credit risk. |
| 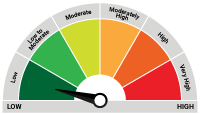 Investors understand that their principal will be at Low Risk |
Quantum Dynamic Bond Fund An Open-ended Dynamic Debt Scheme Investing Across Duration. A relatively high interest rate risk and relatively low credit risk. |
| 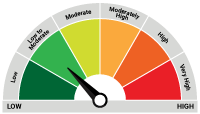 Investors understand that their principal will be at Low to Moderate Risk |
* Investors should consult their financial advisers if in doubt about whether the product is suitable for them.
| Potential Risk Class Matrix – Quantum Dynamic Bond Fund | |||
Credit Risk → | Relatively Low | Moderate (Class B) | Relatively High (Class C) |
Interest Rate Risk↓ | |||
Relatively Low (Class I) | |||
| Moderate (Class II) | |||
| Relatively High (Class III) | A-III | ||
| Potential Risk Class Matrix – Quantum Liquid Fund | |||
Credit Risk → | Relatively Low | Moderate (Class B) | Relatively High (Class C) |
Interest Rate Risk↓ | |||
| Relatively Low (Class I) | A-I | ||
| Moderate (Class II) | |||
| Relatively High (Class III) | |||
Disclaimer, Statutory Details & Risk Factors:
The views expressed here in this article / video are for general information and reading purpose only and do not constitute any guidelines and recommendations on any course of action to be followed by the reader. Quantum AMC / Quantum Mutual Fund is not guaranteeing / offering / communicating any indicative yield on investments made in the scheme(s). The views are not meant to serve as a professional guide / investment advice / intended to be an offer or solicitation for the purchase or sale of any financial product or instrument or mutual fund units for the reader. The article has been prepared on the basis of publicly available information, internally developed data and other sources believed to be reliable. Whilst no action has been solicited based upon the information provided herein, due care has been taken to ensure that the facts are accurate and views given are fair and reasonable as on date. Readers of this article should rely on information/data arising out of their own investigations and advised to seek independent professional advice and arrive at an informed decision before making any investments.
Mutual fund investments are subject to market risks read all scheme related documents carefully.
Related Posts
-

The Pivot
Posted On Friday, Apr 21, 2023
The fiscal year 2022-23 has come to an end. The defining feature
Read More -

Yield Curve Inversion Ahead
Posted On Thursday, Mar 23, 2023
Indian money markets have tightened meaningfully over the last one and a half month.
Read More -

Past, Present, and Future of Inflation
Posted On Friday, Feb 24, 2023
Inflation has been one of the biggest challenges in the post-pandemic world.
Read More


