The Pivot
Posted On Friday, Apr 21, 2023
The fiscal year 2022-23 has come to an end. The defining feature of the last year was high inflation and rising interest rates. Inflation, as measured by consumer price inflation (CPI), averaged at 6.7% YoY in FY23, the highest in 9 years.
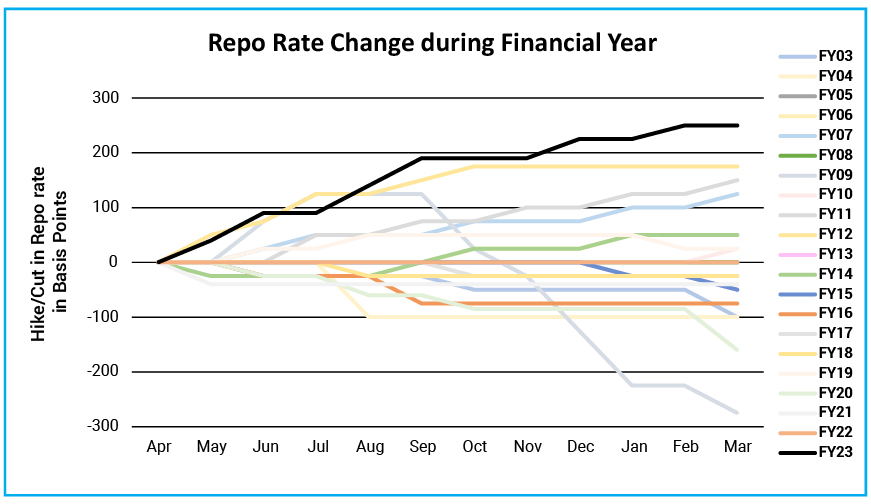
Starting from a low base, in FY23, the RBI delivered the steepest-ever hikes in the repo rate in a financial year. The repo rate moved up by cumulative 250 basis points from 4% to 6.5%.
Chart – I: Repo rate increased at the fastest pace in FY23, in 20 years
Source – Refinitiv, Quantum Research, Data upto March 31, 2023.
Pause or Pivot
In the last monetary policy review in April 2023, the RBI left the policy rates unchanged against the market consensus expectation of a 25-basis points hike. Now, the debate has shifted to whether this is a temporary pause or the end of the rate hiking cycle.
The RBI governor, in his media statement, characterized this move as a ‘pause not pivot’. While the market expectations shifted to the end of the rate hiking cycle.
So, will the RBI hike again?
It can’t be ruled out completely. However, it looks highly unlikely.
Some of the arguments in support of an end of the rate hiking cycle are as follows:
Inflation is trending down: Unlike many parts of the world, in India, inflation was not a result of excessive demand. Rather, it was almost entirely caused by temporary supply chain disruptions and one-off price shocks (Past, Present, and Future of Inflation). The impact of these is now fading.
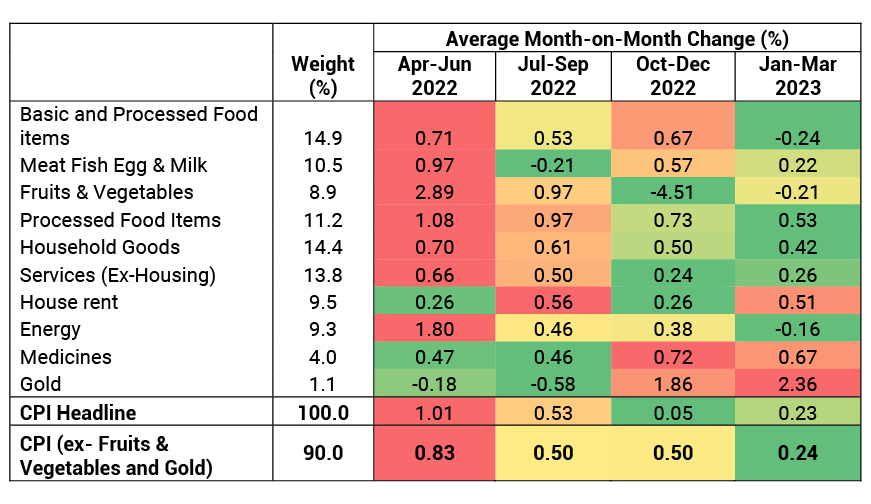
A significant disinflation is already underway with month-on-month inflation across most of the goods and services falling sharply for the last six months (Positioning for Disinflation). The extent of disinflation is not fully captured in the year-on-year inflation numbers yet. Thus, we would expect a sharp drop in CPI inflation in FY24. The current trend supports a decline in inflation to the 4%-5% band without needing any radical policy treatment.
Table – I: Incremental inflation has been moderating across many items
Source - MOSPI, Quantum Research, Data upto March 2023 | #CPI index components are reclassified based on their common drivers for analysis purposes
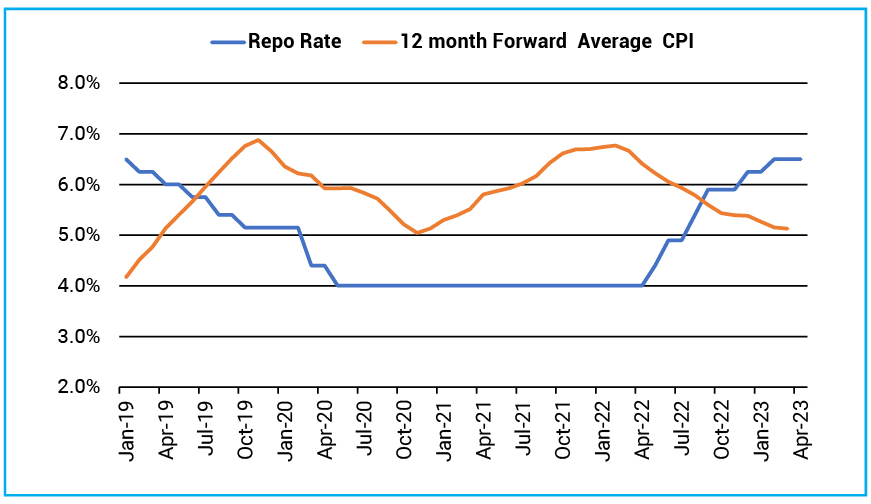
High Positive Real Rates: Last year in April 2022, when the RBI started the rate hiking cycle, the repo rate was at 4% and the CPI inflation for FY23 was expected (RBI’s estimate) at 5.7%. This translated to a real repo rate of minus (-)1.7%.
Now, with the repo rate hiked to 6.5% and the expected CPI inflation of 5.2% in FY24, the real repo rate is positive (+)1.3%.
Given the expected inflation is within the RBI’s tolerance band and sluggish growth outlook, the current level of real rate looks adequate.
Chart- II: Rapid rate hikes took the policy rate above expected inflation
Source- MOSPI, Bloomberg, Quantum Research; Data upto April 2023 | Forward inflation after March 2023 is based on estimates of the Quantum Research team. | Past Performance may or may not sustain in future
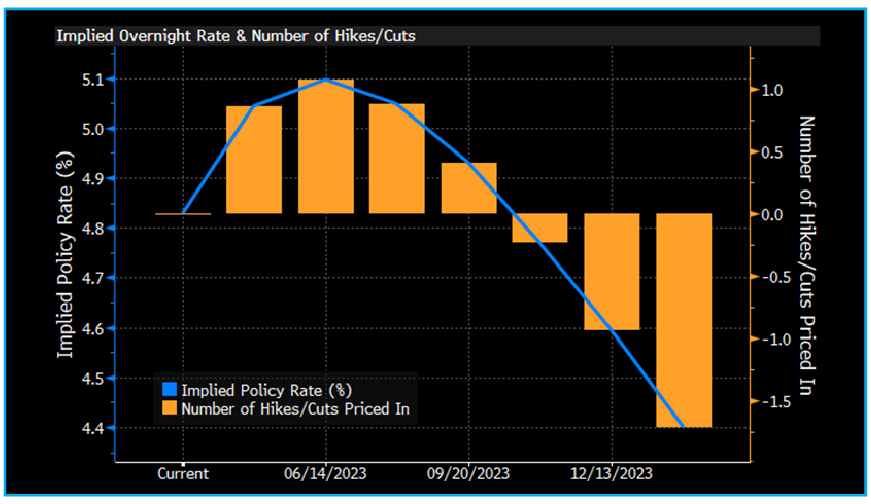
- Global Monetary Policy: After a sharp rise in interest rates in advanced economies over the last 15 months, the monetary policy cycle is now plateauing. The slowing global growth outlook, rising fragility in the financial system, and the fact that interest rates are at multi years high will likely restrict global central banks from remaining on the rate-hiking path for long. This should ease pressure on the RBI.
Chart – III: US Fed is expected to cut rate in H2-2023
Source – Bloomberg, Data as on 18 April 2023
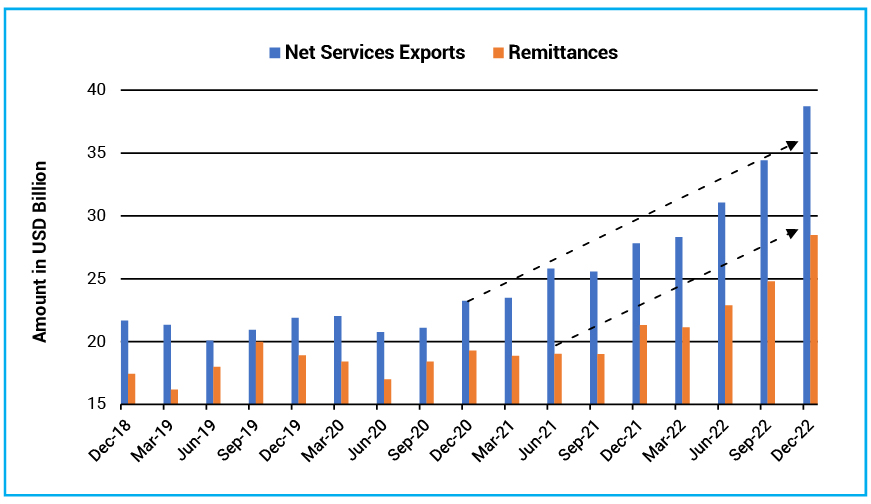
External Balances: Contrary to the initial expectations, India’s external position has been relatively strong aided by a sharp jump in remittances and services exports. The current account deficit for FY23 is now expected at 2% of GDP as against earlier estimates of around 3.4%.
With the drop in crude oil prices and booming services exports, India’s external position is likely to remain comfortable.
Chart - IV: Sharp Jump in Services Exports and Remittances lowered CAD and boosted External Position
Source – CMIE, Quantum Research, Data upto December 2022
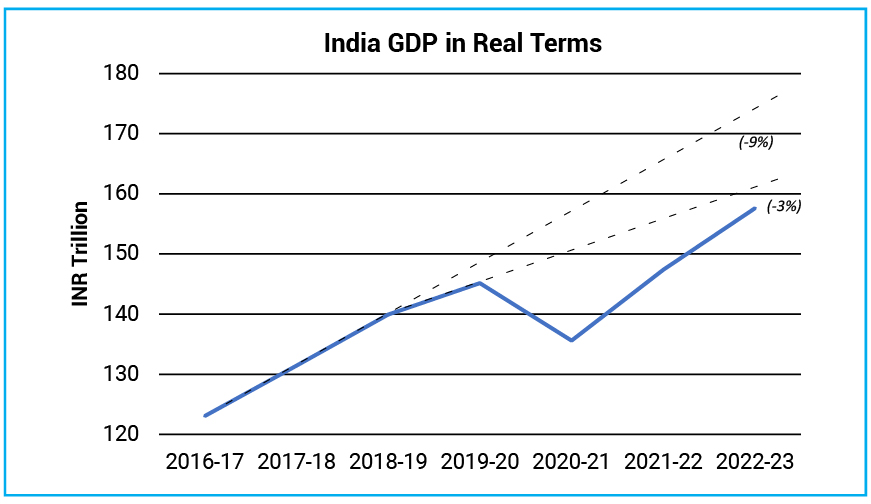
Sluggish Growth Recovery: The RBI has pegged the FY24 GDP growth at 6.5%. While all the other agencies, including the IMF, are projecting growth to be below 6%. The broader street forecast is somewhere between 5.5%-6.0% GDP growth in FY24. The slowing global economy poses a downside risk to these estimates.
Clearly, the economy is growing below its potential, and restrictive monetary policy will obstruct the recovery process.
Chart – V: The economy is yet to recover fully from the pandemic shock
Source – MOSPI, Quantum Research, Data upto March 2023
Based on the above arguments, there is a convincing case for the RBI to end the rate hiking cycle. While the past rate hikes continue to transmit through economic activity.
We would expect an extended pause on rates with the terminal repo rate at 6.5%.
Bonds positioned to gain
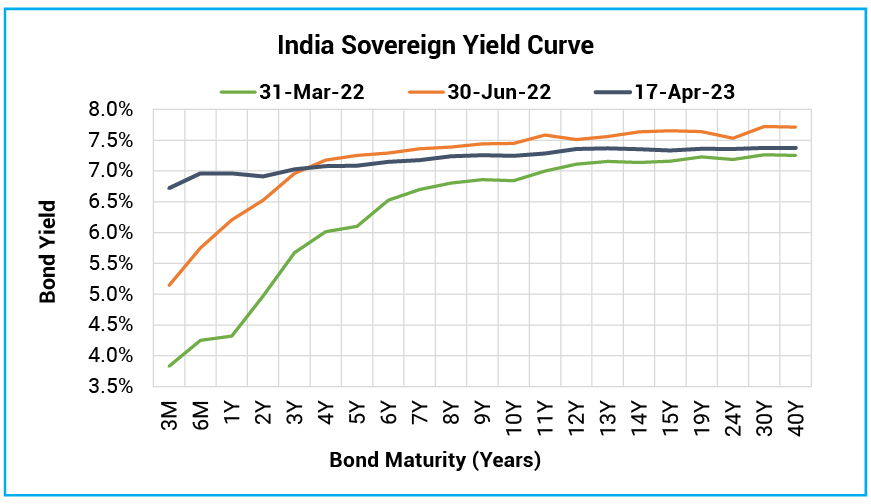
Regular readers of the Debt Market Observer would be aware of our positive stance on the Indian fixed-income market since June 2022. Since then, the yield curve has flattened as short-term rates moved higher along with the RBI’s rate hikes, while longer-term rates came down as uncertainty around the global and domestic monetary policies has lowered.
Chart - VI: India yield curve flattened indicating the peak of the rate hiking cycle
Source – Refinitiv, Quantum Research; Data as of April 17, 2023
Bond yields have come down even more in the last three weeks after the RBI policy. Currently, the 10-year government bond is trading slightly above 7.20%. While the 1–5-year maturity bonds are trading between 6.9%-7.1%.
Going ahead, we expect the trading range for the 10-year government bond yield to shift lower to 7.00%-7.40%. Very short-term up to 2-year yields will face upward pressure from declining liquidity (Curve Inversion Ahead).
At this stage, the 5-10 years maturity government bonds are attractively positioned with a medium-term outlook.
What should Investors do?
Though starting yield has come down from an earlier level, there is decent accrual still available at current levels.
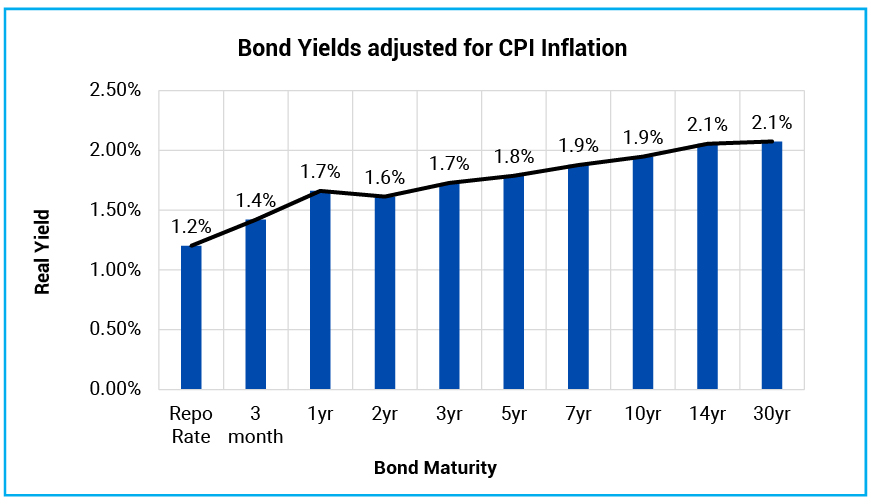
Even in the real term (adjusted for inflation), government bonds are still offering meaningful positive real yield. With expected CPI inflation of 5.2% (RBI’s FY24 inflation estimate) and a 1-year Gsec yield at 6.9%, the real yield is around 170 basis points.
With inflation coming down and a slowing growth outlook, we would expect an increased probability of rate cuts later in the year. This could also open a possibility of capital appreciation over a medium-term horizon.
Chart - VII: Attractive real yields available across the government bond yield curve
Source – Refinitiv, Quantum Research, Data as of April 17, 2023 | # Real rates are based on the RBI’s FY24 average CPI inflation estimate of 5.3%. | Past Performance may or may not sustain in future.
Overall, the return potential of fixed-income funds is still better, and the next three years are likely to be more rewarding for fixed-income investors than what we witnessed in the last three years.
We suggest investors with 2-3 years holding period should consider adding their allocation to dynamic bond funds.
Dynamic bond funds have the flexibility to change the portfolio positioning as per the evolving market conditions. This makes dynamic bond funds better suited for long-term investors in this volatile macro environment than other long-term bond fund categories.
A Dynamic Bond Fund or any other debt fund which invests in long-term debt instruments is highly sensitive to interest rate movements. Thus, in a short period of time, returns could be highly volatile and can even be negative. However, over a longer time frame of over 2-3 years period, returns tend to normalize along with the interest rate cycles.
Chart – VIII: Bond Fund Investments require a longer holding period
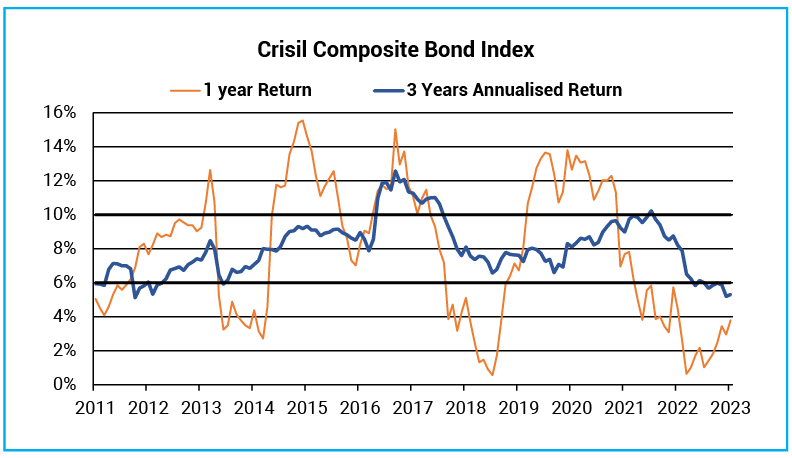
Source – AMFI Portal, Crisil, Quantum Research; Data as of March 31, 2023 | Past Performance may or may not be sustained in future
Investors with shorter investment horizons and low-risk appetites should stick with liquid funds. Tightening liquidity conditions will continue to put upward pressure on short-term rates and is, in turn, positive for short-term debt fund categories like the liquid fund. We would expect further improvement in the return potential of these categories as interest accrual on short-term debt instruments has risen meaningfully.
Since the interest rate on bank saving accounts are not likely to increase quickly while the returns from the liquid fund are already seeing an increase, investing in liquid funds looks more attractive for your surplus funds.
Chart – IX: Liquid Fund Yields Moved up Tracking Treasury Bill Rate; Gap between Liquid fund yield and saving bank interest rate widened further
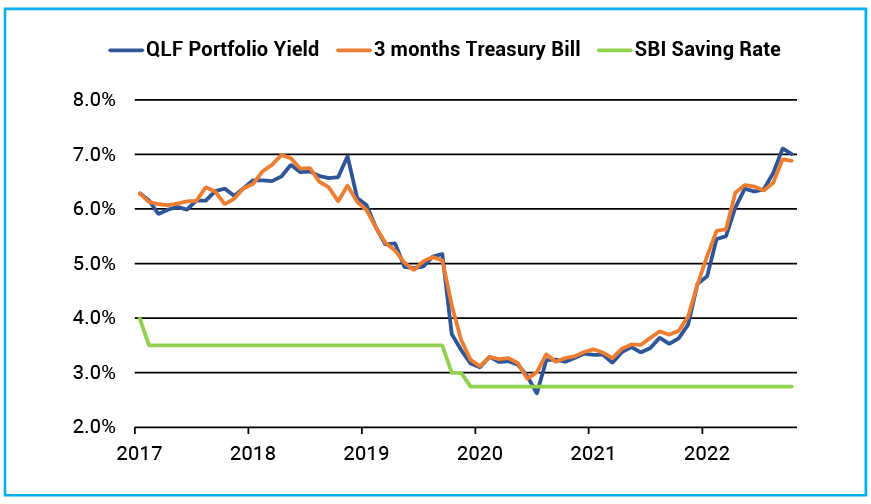
Source – Refinitiv, Quantum Research; Data as of March 31, 2023 | Past Performance may or may not be sustained in future
Investors with a short-term investment horizon and with little desire to take risks should invest in liquid funds which own government securities and do not invest in private sector companies which carry lower liquidity and higher risk of capital loss in case of default.
Portfolio Positioning
Scheme Name | Strategy |
The scheme continues to invest in debt securities of up to 91 days of maturity issued by the government and selected public sector companies. | |
The scheme continues to invest in debt securities issued by the government and selected public sector companies. The scheme follows an active duration management strategy and increases/decreases the portfolio’s sensitivity to interest rates in line with Interest Rate Outlook. The QDBF portfolio is currently positioned as a barbell with heavy allocation to a Floating rate bond and the 10-year segment which reflect a good mix of high accrual and potential for capital appreciation if bond yields fall. We remain positive from a medium-term perspective. |
For any queries directly linked to the insights and data shared in the newsletter, please reach out to the author – Pankaj Pathak, Fund Manager – Fixed Income at [email protected].
For all other queries, please contact Neeraj Kotian – Area Manager, Quantum AMC at [email protected] / [email protected] or call him on Tel: 9833289034
Read our last few Debt Market Observer write-ups -
- Yield Curve Inversion Ahead
- Past, Present, and Future of Inflation
Portfolio Information Scheme Name: Quantum Liquid Fund | |
| Description (if any) | |
Annualised Portfolio YTM*: | 7.00% |
Macaulay Duration | 35 days |
Residual Maturity | 35 days |
As on (Date) | 31-03-2023 |
*in case of semi annual YTM, it will be annualised
| Performance of the Scheme | Direct Plan | |||||
| Quantum Liquid Fund - Direct Plan - Growth Option | ||||||
| Current Value ₹10,000 Invested at the beginning of a given period | ||||||
| Period | Scheme Returns (%) | Tier 1 - Benchmark# Returns (%) | Additional Benchmark Returns (%)## | Scheme (₹) | Tier 1 - Benchmark# Returns (₹) | Additional Benchmark Returns (₹)## |
| Since Inception (07th Apr 2006) | 6.74% | 6.78% | 6.07% | 30,279 | 30,496 | 27,222 |
| Mar 28, 2013 to Mar 31, 2023 (10 years)** | 6.21% | 6.64% | 6.29% | 18,275 | 19,032 | 18,418 |
| Mar 31, 2016 to Mar 31, 2023 (7 years)** | 5.26% | 5.71% | 5.82% | 14,321 | 14,754 | 14,859 |
| Mar 31, 2018 to Mar 31, 2023 (5 years)** | 4.85% | 5.26% | 5.53% | 12,675 | 12,923 | 13,092 |
| Mar 31, 2020 to Mar 31, 2023 (3 years)** | 3.99% | 4.36% | 4.30% | 11,244 | 11,365 | 11,347 |
| Mar 31, 2022 to Mar 31, 2023 (1 year)** | 5.47% | 5.77% | 4.49% | 10,547 | 10,577 | 10,449 |
| Feb 28, 2023 to Mar 31, 2023 (1 month)* | 7.27% | 7.18% | 8.83% | 10,062 | 10,061 | 10,075 |
| Mar 16, 2023 to Mar 31, 2023 (15 days)* | 7.24% | 7.28% | 8.54% | 10,030 | 10,030 | 10,035 |
| Mar 24, 2023 to Mar 31, 2023 (7 days)* | 7.52% | 7.40% | 7.69% | 10,014 | 10,014 | 10,015 |
#CRISIL Liquid Fund AI Index, ##CRISIL 1 year T-bill Index.
Past performance may or may not be sustained in the future.
Different Plans shall have a different expense structure.
*Simple Annualized.
**Returns for 1 year and above period are calculated on the basis of Compounded Annualized Growth Rate (CAGR).
Returns are net of total expenses.
The Scheme is managed by Mr. Pankaj Pathak. Click here for performance details of other funds managed by him.
| Performance of the Scheme | Direct Plan | |||||
| Quantum Dynamic Bond Fund - Direct Plan - Growth Option | ||||||
| Current Value ₹10,000 Invested at the beginning of a given period | ||||||
| Period | Scheme Returns (%) | Tier 1 - Benchmark# Returns (%) | Additional Benchmark Returns (%)## | Scheme (₹) | Tier 1 - Benchmark# Returns (₹) | Additional Benchmark Returns (₹)## |
| Since Inception (19th May 2015) | 7.70% | 7.54% | 6.08% | 17,934 | 17,721 | 15,917 |
| March 31, 2016 to March 31, 2023 (7 years) | 7.46% | 7.38% | 5.74% | 16,552 | 16,465 | 14,783 |
| March 28, 2018 to March 31, 2023 (5 years) | 6.82% | 7.18% | 5.81% | 13,916 | 14,152 | 13,270 |
| March 31, 2020 to March 31, 2023 (3 years) | 5.11% | 5.31% | 2.70% | 11,612 | 11,680 | 10,831 |
| March 31, 2022 to March 31, 2023 (1 year) | 5.41% | 3.29% | 3.43% | 10,541 | 10,329 | 10,343 |
#CRISIL Dynamic Bond Fund AIII-Index, ##CRISIL 10 Year Gilt Index.
Past performance may or may not be sustained in the future.
Different Plans shall have a different expense structure.
Returns are net of total expenses and are calculated on the basis of Compounded Annualized Growth Rate (CAGR).
The Scheme is managed by Mr. Pankaj Pathak. Click here for performance details of other funds managed by him.
Name of the Scheme | This product is suitable for investors who are seeking* | Riskometer |
Quantum Liquid Fund An Open-ended Liquid Scheme. A relatively low interest rate risk and relatively low credit risk. |
| 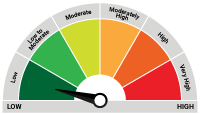 Investors understand that their principal will be at Low Risk |
Quantum Dynamic Bond Fund An Open-ended Dynamic Debt Scheme Investing Across Duration. A relatively high interest rate risk and relatively low credit risk. |
| 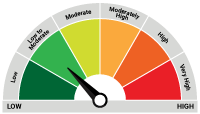 Investors understand that their principal will be at Low to Moderate Risk |
* Investors should consult their financial advisers if in doubt about whether the product is suitable for them.
| Potential Risk Class Matrix – Quantum Dynamic Bond Fund | |||
Credit Risk → | Relatively Low | Moderate (Class B) | Relatively High (Class C) |
Interest Rate Risk↓ | |||
Relatively Low (Class I) | |||
| Moderate (Class II) | |||
| Relatively High (Class III) | A-III | ||
| Potential Risk Class Matrix – Quantum Liquid Fund | |||
Credit Risk → | Relatively Low | Moderate (Class B) | Relatively High (Class C) |
Interest Rate Risk↓ | |||
| Relatively Low (Class I) | A-I | ||
| Moderate (Class II) | |||
| Relatively High (Class III) | |||
Disclaimer, Statutory Details & Risk Factors:
The views expressed here in this article / video are for general information and reading purpose only and do not constitute any guidelines and recommendations on any course of action to be followed by the reader. Quantum AMC / Quantum Mutual Fund is not guaranteeing / offering / communicating any indicative yield on investments made in the scheme(s). The views are not meant to serve as a professional guide / investment advice / intended to be an offer or solicitation for the purchase or sale of any financial product or instrument or mutual fund units for the reader. The article has been prepared on the basis of publicly available information, internally developed data and other sources believed to be reliable. Whilst no action has been solicited based upon the information provided herein, due care has been taken to ensure that the facts are accurate and views given are fair and reasonable as on date. Readers of this article should rely on information/data arising out of their own investigations and advised to seek independent professional advice and arrive at an informed decision before making any investments.
Mutual fund investments are subject to market risks read all scheme related documents carefully.
Related Posts
-

The Pivot
Posted On Friday, Apr 21, 2023
The fiscal year 2022-23 has come to an end. The defining feature
Read More -

Yield Curve Inversion Ahead
Posted On Thursday, Mar 23, 2023
Indian money markets have tightened meaningfully over the last one and a half month.
Read More -

Past, Present, and Future of Inflation
Posted On Friday, Feb 24, 2023
Inflation has been one of the biggest challenges in the post-pandemic world.
Read More


