India Poised for a Sovereign Rating Upgrade
Posted On Friday, Nov 22, 2024
In the recently concluded rating reviews, the big three rating agencies - S&P, Moody’s and Fitch reaffirmed India’s long term sovereign credit rating at “BBB-” (equivalent rating “Baa3” by Moody’s), the lowest investment grade rating. Moody’s and Fitch maintained their rating outlook as “Stable” while the S&P upgraded the outlook to “Positive” indicating an increased prospect of a rating upgrade in future.
Table - I: Snapshot of India’s Sovereign Rating Review
| Moody’s | S&P | Fitch | |
| Rating | Baa3 | BBB- | BBB- |
| Outlook | Stable | Positive | Stable |
| Key Positives | Large and diversified economy, High growth potential, Sound external position, Stable domestic financing base for government debt | A dynamic and fast-growing economy, Strong external balance sheet, Democratic institutions/policy predictability | Strong medium-term growth outlook, Solid external finance position, Strengthening fiscal credibility |
| Key Negatives | Low per Capita Income, High debt levels, Weak debt affordability | Government's weak fiscal performance and burdensome debt stock, low GDP per capita | Weak Fiscal metrics – deficit, debt and debt service burden vs ‘BBB’ peers, Lagging structural metrics, including governance indicators and GDP per capita |
| Rating Upside | Progress on fiscal consolidation leading to a material decline in the government's debt burden and improvement in debt affordability. Effective implementation of new and existing structural reforms that resulted in a significant pickup in private sector investment, higher GDP per capita and broader economic diversification. | Fiscal deficits narrow meaningfully such that the net change in general government debt falls below 7% of GDP on a structural basis. A sustained and substantial improvement in the central bank's monetary policy effectiveness and credibility, such that inflation is managed at a durably lower rate over time. | Sustained commitment to a fiscal strategy of deficit reduction that is consistent with keeping general government debt and interest/ revenue ratio on a steady downward trend. Increased confidence in the sustainability of high medium-term growth, for instance through greater evidence of a durable improvement in the private investment cycle. |
| Rating Downside | Escalation of political tensions and/or a further weakening of checks and balances that would undermine India's long-term growth potential. Durably weaker growth than currently projected and rise in the debt burden, A resurgence of financial sector stress not addressed promptly and effectively | Erosion of political commitment to maintain sustainable public finances, which in turn signifies a weakening of the country's institutional capacity. Current account deficits widen materially to weaken India's external position such that the country becomes a narrow net external debtor | Stalling fiscal consolidation efforts or an economic shock that leads to a significant rise in the government debt/GDP ratio in the medium term. A structurally weaker real GDP growth outlook that further weighs on the debt trajectory or prevents a closer alignment of per capita GDP with the peer median. |
| Outlook | Economic growth to be sustained at well above 6% over the next two fiscal years The pace of fiscal consolidation to remain gradual on general government level Debt affordability ratio to remain weak as compared to Baa-rated emerging market peers | GDP expanding close to 7% over the next three years. General government deficit to decline to 7.9% of GDP by FY25 and to 6.8% by FY28. External position to remain strong with modest CAD over next three years | Strong growth momentum to continue Sustained gradual consolidation in general government deficit to 7.3% of GDP by FY27 and 6.6% by FY29. Modest decline in public debt/GDP from to ~78% by FY29. |
Source – S&P Global, Moody’s, Fitch Ratings
All the three agencies cited India's strong external accounts and growth potential as sources of credit strength. While the low GDP per capita, high public debt, and large general government deficit were pointed out as weaknesses.
In this note, we aim to highlight several current trends that have the potential to significantly enhance India's credit profile and could contribute to a credit rating upgrade in the near future.
• Falling Oil Intensity of the Economy
With 86% of its entire oil demand being covered by imports, India remains sensitive to changes in global oil prices. Nonetheless, the Indian economy's dependency on oil has been declining steadily, which in turn is enhancing its tolerance to higher oil price and reducing its vulnerability from external shocks. Ceteris paribus, lowering oil imports bill will reduce the drain on domestic savings and boost economic growth.
In FY24, despite crude oil prices staying above USD 80/barrel, the current account deficit stayed well below 1% of GDP. |
Chart – I: India’s dependence of Oil is on decline

Source – CMIE, Quantum Internal Research; Data up to FY24
• Reducing External Debt
India’s external debt as proportion of GDP has been on a steady decline for the last 10 years. This should reduce India’s external vulnerability and strengthen the balance of payments position going forward.
Chart – IV: Falling External Debt/GDP to boost BOP position

Source – CMIE, Quantum Internal Research; Data up to FY24
• India leading the Services Globalisation Wave
India’s exports of services have picked up sharply in the last 3 years growing at a CAGR of 22.5%. India’s services trade is benefiting significantly from the boom in Global Capability Centres (GCCs) - offshore centres established by multinational firms to provide various services to their parent organisations. As per the global consulting firm Ernest & Young, India consisted 55% of the world's GCC centres in 2022, 1,580 centres in 2023. It is projected that the GCCs in India will cross 1,900 centres by 2025 and 2,400 centres by 2030.
While IT services continue to be the primary driver, other emerging sectors such as legal, consulting, research and development, among others, are making significant strides, fuelled by the rapid advancements in communication technologies in recent years.
Given the ongoing trend of services globalisation and India’s dominant position in services trade, we would expect the services trade surplus to maintain its upward momentum. This will further solidify the India’s external accounts and boost the economic growth potential.
Chart – II: Rapidly growing Services exports to strengthen external position

Source – CMIE, Quantum Internal Research, Data up to FY24
• Increasing Tax Buoyancy
Tax collections for both the Central and States governments are growing as a proportion of GDP. Formalization of the Indian economy has expanded the tax base and increased the tax compliance in the last few years. This trend is likely to continue in coming years.
As the Tax-to-GDP ratio increases, the government will gain greater flexibility in managing its finances. This is likely to bolster its efforts toward fiscal consolidation and debt reduction. Consequently, we anticipate notable improvements in fiscal indicators over the next 2–3 years.
Chart – III: Rising Tax Collections to aid Fiscal Matrices

Source – CMIE, Quantum Internal Research; FY25 numbers based on Budget estimates
• Government Spending and Infrastructure Investment
Government’s expenditure pattern has changed significantly over the last few years with increasing focus on infrastructure creation than welfare programs. Over the last 10 years, the government has invested heavily in infrastructure projects such as roads, ports, railways, water supply, housing, irrigation etc that should boost the productive capacity of the economy. Improving quality of government expenditure will be supportive for the credit profile.
Chart – V: Improving Quality of Government expenditure is credit positive

Source – Indiabudget.gov.in, CMIE, Quantum Internal Research,
# Orange line shows total spending on food subsidies, PM Kisan and MGNAREGA
• Growing Domestic Funding Source
Domestic institutional investors, including insurance companies, pension funds, and provident funds, have experienced rapid growth in recent years, driven by ongoing trends in formalization and financialization. This growth has increased demand for long-term bonds and established a stable domestic funding source for public debt.
Chart – VI: Growing Domestic investors to provide stable funding source
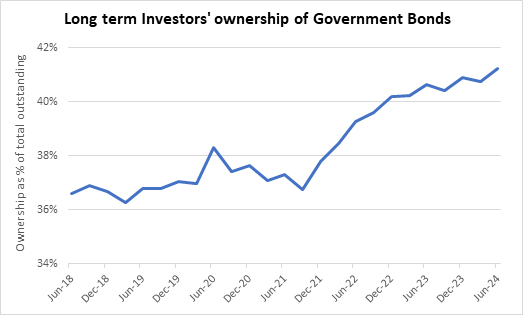
Source - RBI, Quantum Research, Data up to June 2024
# This includes ownership of government bonds by Insurance companies, PFs, provident Funds and others
Conclusion
India's high public debt and low per capita income may continue to weigh on its credit profile. However, several trends suggest notable improvements in fiscal and external balance sheets, along with enhanced resilience to external shocks.
Considering India's growing economic potential, robust and improving external balances, strengthened corporate and financial sector balance sheets, and enhanced resilience to external shocks, we believe there is a compelling case for an upgrade in India's credit rating.
From the market's perspective, an improvement in India’s credit profile is positive, regardless of the actions of global rating agencies. A favourable demand-supply dynamic in the bond market and a strong external position are expected to continue supporting the Indian bond market in the future.
We expect bond yields to remain on downward path over the next 12-24 months. (refer Bull Case Revisited)
What should Investors do?
Dynamic Bond Funds are probably best placed to capture this opportunity with a flexibility to change if things don’t pan out as expected. However, investors need to have a longer holding period of at-least 2-3 years to ride through the intermittent volatility.
Investors with shorter investment horizons and low-risk appetites should stick with liquid funds.
Portfolio Positioning
Scheme Name | Investment Approach |
The scheme invests in debt securities of up to 91 days of maturity issued by the government and selected public sector companies. | |
The scheme to invest in debt securities issued by the government and selected public sector companies. The scheme follows an active duration management strategy and increases/decreases the portfolio duration (sensitivity to interest rates changes) in accordance with the Interest Rate Outlook. Given our positive view on the bond market, we are maintaining reasonably high duration in the scheme with bulk of the assets in 10-30 year maturity bucket. |
Source – RBI, Blomberg, Refinitiv, MOSPI, IndianBudget.gov.in, CCIL, Asia Bond Monitor, Internal Research
For any queries directly linked to the insights and data shared in the newsletter, please reach out to the author – Pankaj Pathak, Fund Manager – Fixed Income at [email protected].
For all other queries, please contact Neeraj Kotian – Area Manager, Quantum AMC at [email protected] / [email protected] or call him on Tel: 9833289034
Read our last few Debt Market Observer write-ups -
- US Rate Cut from Indian Lens - A historical Perspective
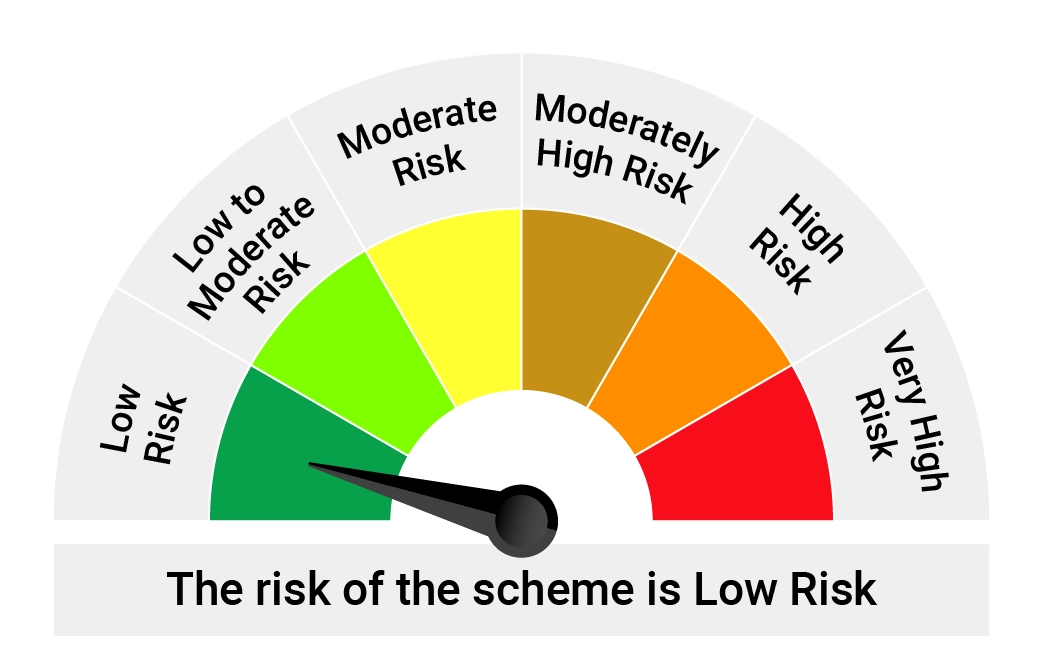
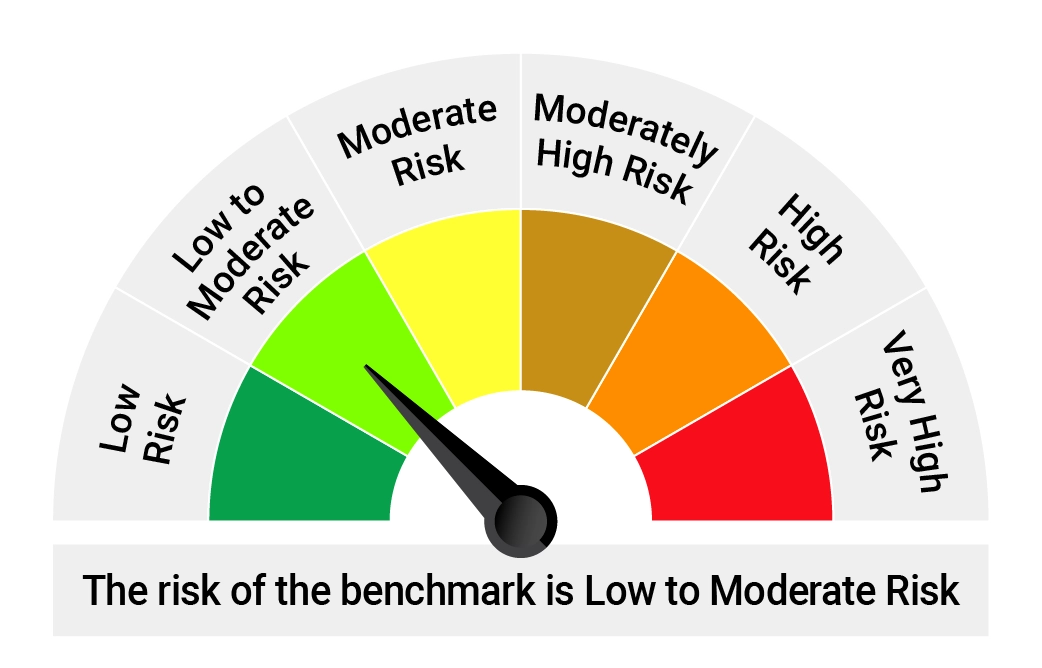
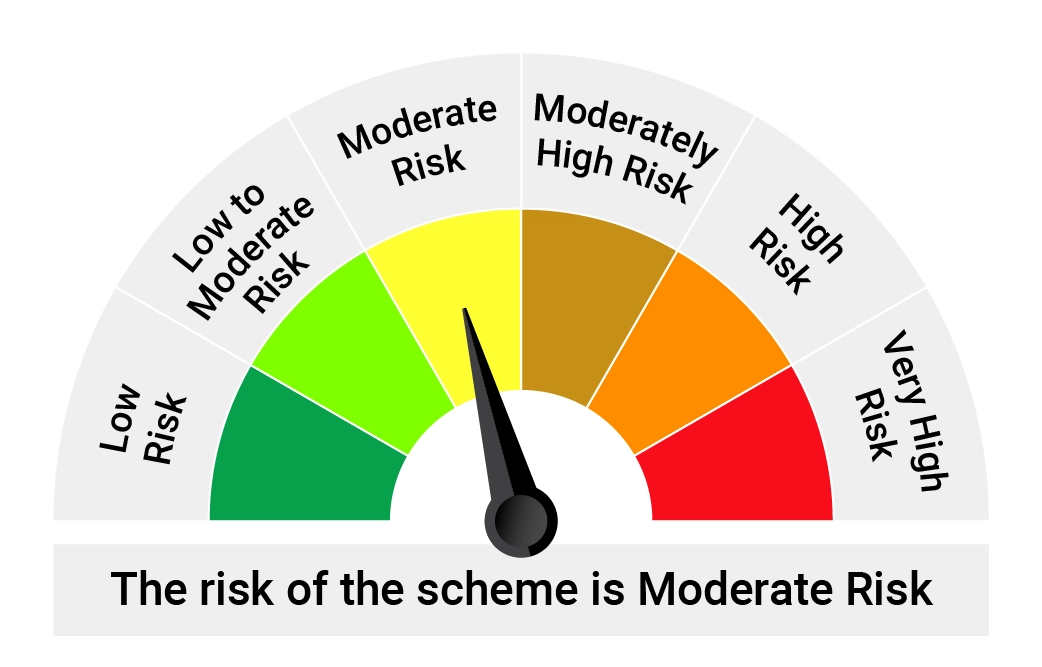
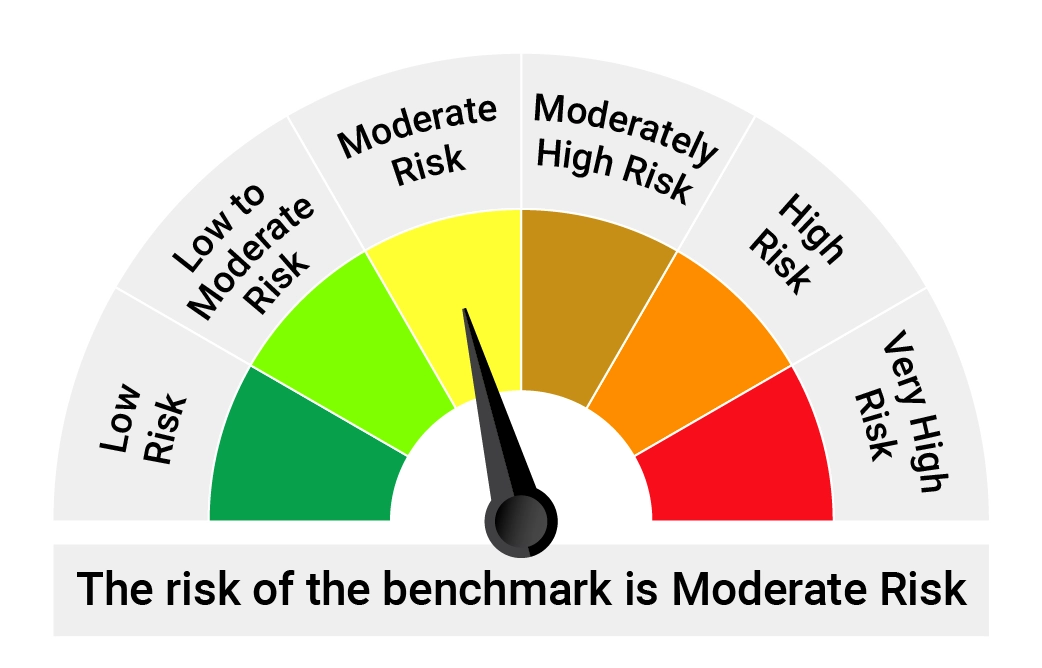
Name of the Scheme | This product is suitable for investors who are seeking* | Riskometer of Scheme | Riskometer of Tier I Benchmark |
Quantum Liquid Fund An Open-ended Liquid Scheme. A relatively low interest rate risk and relatively low credit risk. Tier I Benchmark : CRISIL Liquid Debt A-I Index |
|  |  |
Quantum Dynamic Bond Fund An Open-ended Dynamic Debt Scheme Investing Across Duration. A relatively high interest rate risk and relatively low credit risk. Tier I Benchmark : CRISIL Dynamic Bond A-III Index |
|  |  |
*Investors should consult their financial advisers if in doubt about whether the product is suitable for them.
| Potential Risk Class Matrix – Quantum Liquid Fund | |||
Credit Risk → | Relatively Low | Moderate (Class B) | Relatively High (Class C) |
Interest Rate Risk↓ | |||
| Relatively Low (Class I) | A-I | ||
| Moderate (Class II) | |||
| Relatively High (Class III) | |||
| Potential Risk Class Matrix – Quantum Dynamic Bond Fund | |||
Credit Risk → | Relatively Low | Moderate (Class B) | Relatively High (Class C) |
Interest Rate Risk↓ | |||
Relatively Low (Class I) | |||
| Moderate (Class II) | |||
| Relatively High (Class III) | A-III | ||
Disclaimer, Statutory Details & Risk Factors:The views expressed here in this article / video are for general information and reading purpose only and do not constitute any guidelines and recommendations on any course of action to be followed by the reader. Quantum AMC / Quantum Mutual Fund is not guaranteeing / offering / communicating any indicative yield on investments made in the scheme(s). The views are not meant to serve as a professional guide / investment advice / intended to be an offer or solicitation for the purchase or sale of any financial product or instrument or mutual fund units for the reader. The article has been prepared on the basis of publicly available information, internally developed data and other sources believed to be reliable. Whilst no action has been solicited based upon the information provided herein, due care has been taken to ensure that the facts are accurate and views given are fair and reasonable as on date. Readers of this article should rely on information/data arising out of their own investigations and advised to seek independent professional advice and arrive at an informed decision before making any investments. Mutual Fund investments are subject to market risks, read all scheme related documents carefully. |
Related Posts
-

The Pivot
Posted On Friday, Apr 21, 2023
The fiscal year 2022-23 has come to an end. The defining feature
Read More -

Yield Curve Inversion Ahead
Posted On Thursday, Mar 23, 2023
Indian money markets have tightened meaningfully over the last one and a half month.
Read More -

Past, Present, and Future of Inflation
Posted On Friday, Feb 24, 2023
Inflation has been one of the biggest challenges in the post-pandemic world.
Read More


