In the Rear View
Posted On Thursday, Jan 25, 2024
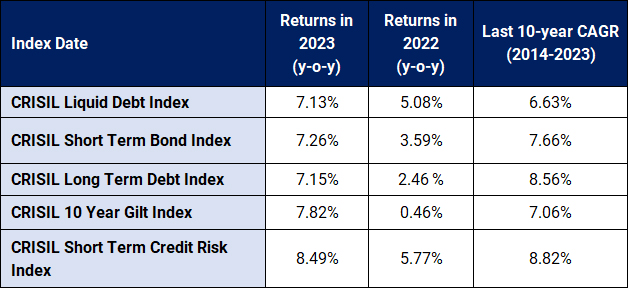
Amidst high inflation, tightening monetary policy and broadening geopolitical conflicts, Indian fixed income managed to deliver healthy returns across all sectors in 2023. Crisil 10-year Gilt Index which tracks the performance of 10-year Indian government bond, retuned 7.82% in the year. While the Crisil Liquid Debt Index which comprises of below 3 months maturity debt papers, delivered 7.13%.
Chart – I: US Rate setting panel (FOMC) is indicating 75bps rate cut in 2024
Source – AMFI, Quantum Research; data up December 31, 2023
Past performance may or may not sustain in future.
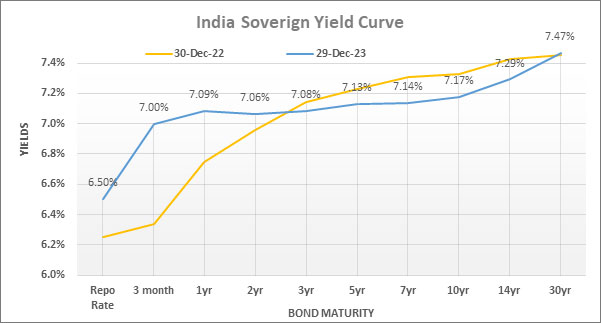
Short term yields moved up during the year due of tight liquidity conditions towards the end of the year. While longer term bond yields declined, thanks to strong demand from long term domestic investors. Consequently, the yield curve flattened during the year.
Chart – I: India Yield Curve Flattened owing to liquidity tightness and increased demand for long bonds
Source – Refinitiv, Quantum Research; Data upto of December 29, 2023
Past performance may or may not sustain in future
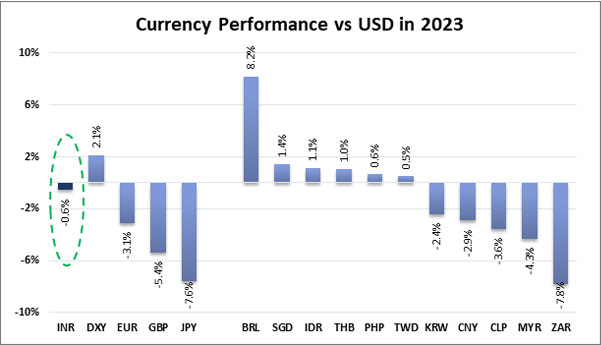
Indian currency showed remarkable resilience to global volatility. The Indian Rupee traded in a narrow range between 81 to 83.5 per USD through the year. It posted a marginal decline of 0.60% as against 2.1% rise in the Dollar index for the year 2023.
Chart – II: Indian Rupee outperformed global peers
Source – Bloomberg; Quantum Research; data as of December 31, 2023
Past performance may or may not sustain in future.
What lies Ahead?
Outlook for the Indian fixed income looks positive. Some of the factors that support our view are as follows:
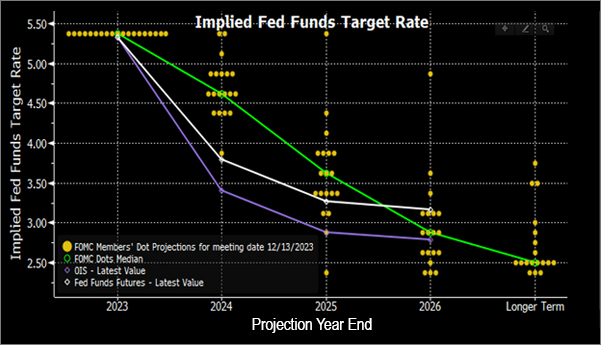
Global policy reversal - The global synchronized rate hiking cycle has come to a halt. In 2024, most of the central banks are expected to cut rates. Monetary easing in advance economies should be favourable for emerging markets like India as capital flows into EMs tend to increase during rate cutting cycle.
Chart – III: US Rate setting panel (FOMC) is indicating 75bps rate cut in 2024
Source – Bloomberg, Data as of December 2023
Yellow dots represent each FOMC members’ projection of future Fed Funds Rate; the green line shows the median estimate for the same.
Core disinflation: Domestically, CPI inflation has been highly volatile due to volatile food prices in the last few months. However, the Core CPI, which excludes the volatile food and energy prices, has been coming down consistently over the last twelve months.
In December 2023, the Core-CPI dropped below the RBI’s 4% target (3.9% y-o-y for December 23). Based on the current trend, the Core-CPI is expected to slide down further to around 3.4% by Mid-2024.
Although the RBI’s target is based on headline CPI, it would draw comfort from falling core inflation which tends to be more sticky.
Chart – IV: Falling Core Inflation (ex-Food and Fuel) to ease pressure from the RBI
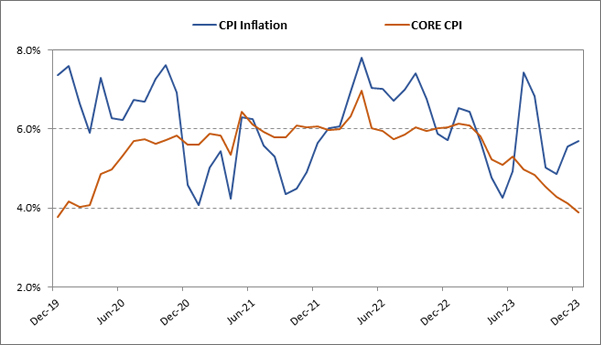
Source – MOSPI, Quantum Research, Data upto November 2023
RBI’s Rate cut debate – With declining inflation trend and rising real interest rates, some members of the monetary policy committee (MPC) have started to make a case for rate cuts. We expect the debate about rate cuts to intensify in coming MPC meetings.
The RBI is widely expected to change the stance from ‘withdrawal of accommodation’ to ‘neutral’ in the February MPC meeting and start cutting rates in the second half of CY 2024.
Chart – V: Real Repo Rate is near 2% - presenting case for Rate Cuts
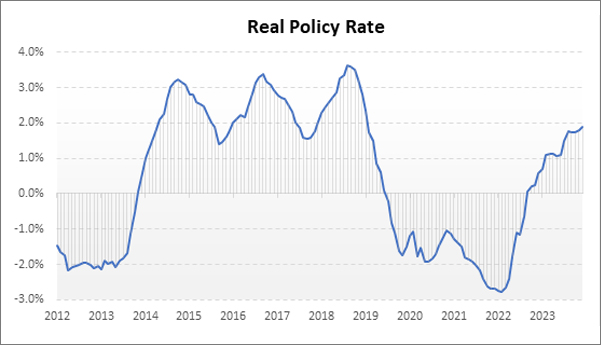
Source – Refinitiv, MOSPI, Quantum Research; Data Upto December 29, 2023
Real Policy Rate = Repo Rate – average CPI for forward 12 months. Real Rate from January 2023 to December 2023 includes on Quantum’s estimate of forward CPI.
Past performance may or may not sustain in future
Demand outpacing supply: The demand-supply dynamics in the bond market in likely to change significantly over the next two years. While the fiscal deficit expanded to 9.2% of GDP during pandemic shock in FY2020-21. The government has been on a path of fiscal consolidation with an aim to bring down the fiscal deficit to 4.5% of GDP by FY 2025-26.
The government is on the path to achieve its fiscal deficit of 5.9% of GDP for the current financial year. Based on the glide path, the fiscal deficit target for FY2024-25 should be around 5.3% of GDP. With this target, the government’s gross market borrowing will be Rs. 800 billion lower than past year at around Rs. 14.6 trillion.
Given the healthy growth trend in bonds demand from long term investors like Insurance companies, pension funds, PFs etc, we expect the total government bond supply to fall short of demand over the next two years.
Chart – VI: Fiscal consolidation to reduce bond supply
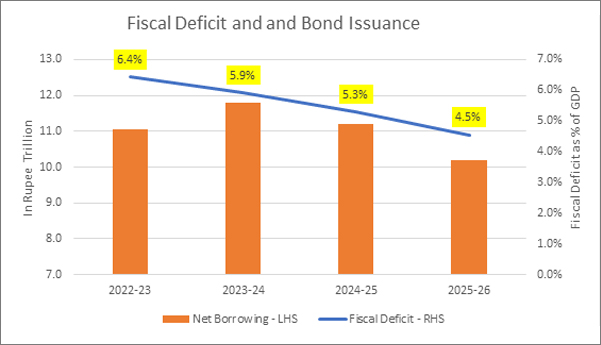
Source – IndianBudget.gov.in, Quantum Research
Data for FY25 and FY26 is based on Quantum Research team’s estimates
Bond Index Inclusion:
India will be included in the JP Morgan GBI-EM Index starting June 2024. Another global index provider, Bloomberg has also proposed to include India (subject to approval by index participants) in the Bloomberg EM Local Currency Debt Index starting September 2024.
Foreigners are under invested in Indian bond market with only 1.61% of total outstanding government bonds owned by foreign investors. (Data as of September 2023). India’s inclusion in the global bond indices is expected to attract USD 25-30 billion of foreign investments into Indian bonds over the next 12 months.
FPIs (foreign portfolio investors) have been consistently buying Indian government bonds eligible for FAR (Fully Accessible Route) in 2023. We expect the pace of FPI buying to increase substantially over the coming month.
Chart – VII: Indian Bonds are under-owned by foreigners
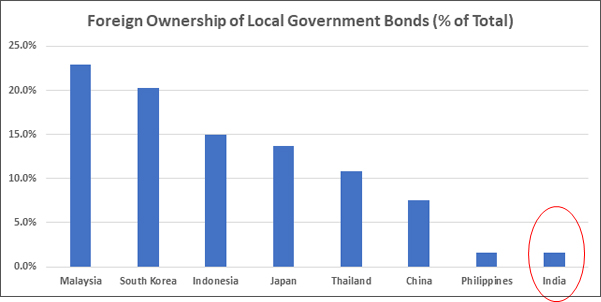
Source – www.asianbondsonline.adb.org, RBI, Quantum Research; Data upto September 30, 2023
What should Investors do?
Considering a strong case for yields to decline over the next 1-2 years backed by the reasons described above, we believe long term government bonds offer a rewarding opportunity.
Dynamic Bond Funds are probably best placed to capture this opportunity with a flexibility to change if things don’t pan out as expected. However, investors need to have a longer holding period of at-least 2-3 years to ride through the intermittent volatility.
Investors with shorter investment horizons and low-risk appetites should stick with liquid funds.
Portfolio Positioning
Scheme Name | Strategy |
The scheme invests in debt securities of up to 91 days of maturity issued by the government and selected public sector companies. | |
The scheme to invest in debt securities issued by the government and selected public sector companies. The scheme follows an active duration management strategy and increases/decreases the portfolio duration (sensitivity to interest rates changes) in accordance with the Interest Rate Outlook. Given our positive view on the bond market, we are maintaining reasonably high duration in the scheme with bulk of the assets in 10-14 year maturity bucket. |
Source – RBI, Quantum Mutual Fund
For any queries directly linked to the insights and data shared in the newsletter, please reach out to the author – Pankaj Pathak, Fund Manager – Fixed Income at [email protected].
For all other queries, please contact Neeraj Kotian – Area Manager, Quantum AMC at [email protected] / [email protected] or call him on Tel: 9833289034
Read our last few Debt Market Observer write-ups -
- Good Time to Be Bond Investor
Name of the Scheme | This product is suitable for investors who are seeking* | Riskometer |
Quantum Liquid Fund An Open-ended Liquid Scheme. A relatively low interest rate risk and relatively low credit risk. |
| 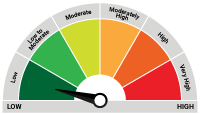 Investors understand that their principal will be at Low Risk |
Quantum Dynamic Bond Fund An Open-ended Dynamic Debt Scheme Investing Across Duration. A relatively high interest rate risk and relatively low credit risk. |
| 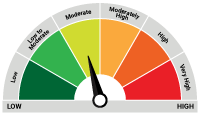 Investors understand that their principal will be at Moderate Risk |
* Investors should consult their financial advisers if in doubt about whether the product is suitable for them.
| Potential Risk Class Matrix – Quantum Dynamic Bond Fund | |||
Credit Risk → | Relatively Low | Moderate (Class B) | Relatively High (Class C) |
Interest Rate Risk↓ | |||
Relatively Low (Class I) | |||
| Moderate (Class II) | |||
| Relatively High (Class III) | A-III | ||
| Potential Risk Class Matrix – Quantum Liquid Fund | |||
Credit Risk → | Relatively Low | Moderate (Class B) | Relatively High (Class C) |
Interest Rate Risk↓ | |||
| Relatively Low (Class I) | A-I | ||
| Moderate (Class II) | |||
| Relatively High (Class III) | |||
Disclaimer, Statutory Details & Risk Factors:The views expressed here in this article / video are for general information and reading purpose only and do not constitute any guidelines and recommendations on any course of action to be followed by the reader. Quantum AMC / Quantum Mutual Fund is not guaranteeing / offering / communicating any indicative yield on investments made in the scheme(s). The views are not meant to serve as a professional guide / investment advice / intended to be an offer or solicitation for the purchase or sale of any financial product or instrument or mutual fund units for the reader. The article has been prepared on the basis of publicly available information, internally developed data and other sources believed to be reliable. Whilst no action has been solicited based upon the information provided herein, due care has been taken to ensure that the facts are accurate and views given are fair and reasonable as on date. Readers of this article should rely on information/data arising out of their own investigations and advised to seek independent professional advice and arrive at an informed decision before making any investments. Mutual fund investments are subject to market risks read all scheme related documents carefully. |
Related Posts
-

The Pivot
Posted On Friday, Apr 21, 2023
The fiscal year 2022-23 has come to an end. The defining feature
Read More -

Yield Curve Inversion Ahead
Posted On Thursday, Mar 23, 2023
Indian money markets have tightened meaningfully over the last one and a half month.
Read More -

Past, Present, and Future of Inflation
Posted On Friday, Feb 24, 2023
Inflation has been one of the biggest challenges in the post-pandemic world.
Read More


