Investment
₹
Posted On Wednesday, May 15, 2024

In the last couple of months, the Indian equity market has been on a rollercoaster ride. There are a variety of factors playing on the market sentiments, and one of them is the general elections & the uncertainty surrounding the equity markets.
2024 has been an elections year with several countries having their national elections scheduled during this time. This includes India, the U.S. countries in Europe, Mexico, Russia, Indonesia, Thailand, North Korea, South Korea, Sri Lanka, Maldives, and several others. Nearly half of the world's population is heading to the polls.
The Indian equity markets amid such times, are already feeling the heat. The small caps segment in particular has been in a tight spot, while mid caps and large caps are comfortably placed.
Should you worry about General Elections?
The outcome of the general elections is set to shape government policies and have an impact on geopolitics, macroeconomic conditions, and society at large thereby influencing the country’s socio and economic outlook.
But as long as India’s real GDP continues to grow above 6.0% -- which has been the case over the last 43+ years -- and it makes a meaningful impact on society at large, as an investor you don’t need to be worried.
In fact, as seen in Graph 1, during the coalition governments, the GDP growth rate has been better. So, in a sense, it does not matter who is in power as long as reforms and good policies continue.
Graph 1: India’s GDP Growth Across Governments has been 6.1% p.a. India may grow >6%!

Note: The number in the red rectangle is from a changed data series starting Jan 2015. While a “superior” series, there is no comparable number to equate the “New” with the “Old”. Most economists deduct 0% to 1.5% from the “New” to equate to the “Old”; therefore, under Modi, the GDP has been at 5.9% at best matching the 5.6% under the BJP-led coalition government of Vajpayee, which resulted in the rout for the BJP at the time of the next election in 2004.* Please note that data used for World GDP for 2021 & 2022 is a median Estimate since World Bank data is not yet available and India GDP data is the government’s third advance estimate released at the end of February 2024.
(Source: RBI and www.parliamentofindia.nic.in; data as of December 2023)
Supported by robust growth reported in FY 2024. India is the fastest-growing economy and is perceived as a “bright spot”.
Graph: In Democracies with Institutional Processes, Stock Markets reflect GDP returns

Source - CMIE, Bloomberg, Quantum Research; GDP data upto September 30, 2023 and Sensex Data as on April 30,2024. Chart is created with both the GDP and Sensex data rebased to 100 on Apr 30, 2024. Past performance may or may not be sustained in the future.
India’s GDP growth has reflected positively on the wealth creation process through equities. Graph 2 exhibits that the bellwether, S&P BSE Sensex has delivered good returns in line with India’s nominal GDP over the long term.
In the general elections Indian equity market has displayed wide fluctuations. But take a look at the table below...
Table 1: Long-Term Have Been Intact Irrespective of the General Election Outcomes

The above table shows the absolute returns of Quantum Long Term Equity Value Fund – Direct Plan – Growth Option. The table should be reviewed conjunction with the detailed performance of the scheme given below. S&P BSE Sensex Total Return is considered.
Past performance may or may not be sustained in the future.
(Source: Bloomberg, Quantum Mutual Fund’s Internal Research)
The table reveals that, on an average, 3 months before and 9 months after general elections, the S&P BSE Sensex-TRI has generated good returns. In the year 2004 when the Vajpayee-led-NDA government was defeated by the United Progressive Alliance led by the Congress, after the initial scepticism, India’s GDP and equity markets fared very well under Dr Manmohan Singh’s watch.
In this context, note the famous quote of legendary value investor, Benjamin Graham: "In the short run, the market is a voting machine but in the long run, it is a weighing machine."
Equity markets would do well as long as corporate earnings reported are good and meet the street expectations. Thankfully, the earnings trend in the last few years has been encouraging. Plus, the fact that India is the fastest-growing major economy (at the fifth spot), justifies the premium that India's equity markets command relative to global peers. That being said, it is important to invest thoughtfully.
You don’t need to be apprehensive or put your investment plans on hold during general elections.
As long as structural reforms continue to be rolled out, by whichever government is in power, the Indian equity markets shall do well in the long run.
The Quantum Long Term Equity Value Fund (QLTEVF) - a value-styled fund - with its disciplined research, robust investment process and systems can help you generate wealth.
Graph 3: QLTEVF Has Delivered Predictable Outcomes Over the Past Several Years

The above graph shows the estimate of rebased GAV of Quantum Long Term Equity Value Fund – Direct Plan – Growth Option on the basis of Upside Potential of the portfolio (equal to the sum total of weight of each stock (multiplied by) the percentage difference between the current market price and the sell limits assigned to each stock in the portfolio by the in-house research teams). The performance returns are net of fees and expenses, and assuming reinvestment of all dividends and other earnings. Past performance may or may not be sustained in the future. The value axis for graph 2 has been plotted based on logarithmic scale of 2. Source: Quantum Research, Bloomberg Finance L.P., As of April 30th, 2024.
Graph 3 depicts that despite the two massive global macro events: Global Financial Crisis and COVID-19, QLTEVF since its inception in March 2006, has delivered consistent returns. It has delivered on its estimation (the orange line in the graph above) and is unshaken by the turbulence of unpredictable markets. In reality, QLTEVF has almost mirrored the actual growth of its portfolio NAV (blue line).
When evaluated across market phases - bull and bear phases - QLTEVF has delivered during upside and protected investors against downsides, as exhibited in Table 2.
Table 2: Capturing the Upside & protect the Downside

Returns expressed are point-to-point in %. calculated using the Direct Plan-Growth option. .Tier 1 benchmark is S&P BSE 500 TRI, Tier 2 benchmark is S&P BSE 200 TRI.
Returns over 1-year are compounded annualised.
Please note, that this table represents past performance. Past performance is not an indicator of future returns.
(Source: ACE MF)
Moreover, when delivering the returns, QLTEVF has not exposed its investors to undue very high risk. On the contrary, the fund has exposed lower risk compared to the S&P BSE Sensex -TRI and the S&P BSE 500 -TRI (see Table 3). As seen in the table, the risk-adjusted returns as reflected by the Sharpe Ratio and Sortino Ratio of QLTEVF are better than the indices.
Table 3: QLTEVF Has Managed the Risk Well and Clocked Decent Risk-Adjusted Returns

Standard Deviation indicates Total Risk and Sharpe Ratio measures the Risk-Adjusted Return. They are calculated over 3 years assuming a risk-free rate of 6% p.a.Past performance may or may not be sustained in future. Data as of April 30, 2024
While equity investment outcomes can be unpredictable, Quantum's commitment to a disciplined approach emerges as a beacon of stability in the financial landscape. It is discipline that brings predictability to QLTEVF’s outcome.
QLTEVF with its ability to deliver predictable outcomes, can form the foundation of your equity investing. It could be a dependable investment option to address your long-term financial goals.
Amidst, general elections don’t get absorbed by the noise. Choose predictable investing and be a thoughtful investor.
To know more about QLTEVF and invest, click here.
Happy Investing!
 |
 |
| Performance of the Scheme | Direct Plan | |||||||
| Quantum Long Term Equity Value Fund - Growth Option | ||||||||
| Current Value ₹10,000 Invested at the beginning of a given period | ||||||||
| Period | Scheme Returns (%) | Tier 1 - Benchmark# Returns (%) | Tier 2 - Benchmark## Returns (%) | Additional Benchmark Returns (%)## | Scheme (₹) | Tier 1 - Benchmark# Returns (₹) | Tier 2 - Benchmark## Returns (₹) | Additional Benchmark Returns (₹)## |
| Since Inception (13th Mar 2006) | 14.39% | 13.32% | 13.33% | 12.72% | 114,680 | 96,728 | 96,814 | 87,912 |
| April 30, 2014 to April 30, 2024 (10 years) | 14.44% | 16.26% | 15.96% | 14.20% | 38,574 | 45,168 | 44,004 | 37,785 |
| April 28, 2017 to April 30, 2024 (7 years) | 12.95% | 15.74% | 15.68% | 15.27% | 23,490 | 27,866 | 27,772 | 27,078 |
| April 30, 2019 to April 30, 2024 (5 years) | 15.46% | 18.19% | 17.59% | 15.13% | 20,534 | 23,088 | 22,501 | 20,245 |
| April 30, 2021 to April 30, 2024 (3 years) | 19.58% | 20.44% | 19.60% | 16.52% | 17,109 | 17,481 | 17,116 | 15,827 |
| April 28, 2023 to April 30, 2024 (1 year) | 41.53% | 38.26% | 35.91% | 23.23% | 14,193 | 13,863 | 13,625 | 12,344 |
Data as of Apr 30, 2024. #S&P BSE 500 TRI, ##S&P BSE 200 TRI, ###S&P BSE Sensex.
Past performance may or may not be sustained in the future.
Load is not taken into consideration in scheme returns calculation.
Different Plans shall have a different expense structure.
Returns are net of total expenses and are calculated on the basis of Compounded Annualized Growth Rate (CAGR).
#with effect from December 01, 2021 Tier I benchmark has been updated as S&P BSE 500 TRI. As TRI data is not available since inception of the scheme, benchmark performance is calculated using composite CAGR S&P BSE 500 index PRI Value from March 13, 2006 to July 31, 2006 and TRI Value since August 1, 2006.
##TRI data is not available since inception of the scheme, Tier II benchmark performance is calculated using composite CAGR S&P BSE 200 index PRI Value from March 13, 2006 to July 31, 2006 and TRI Value since August 1, 2006.
The Scheme is co-managed by Mr. George Thomas & Mr. Christy Mathai. Mr. George Thomas is the Fund Manager managing the scheme since April 1, 2022. Mr. Christy Mathai is the Fund Manager managing the scheme since November 23, 2022.
For other Schemes Managed by Mr. George Thomas & Mr. Christy Mathai, please Click here.
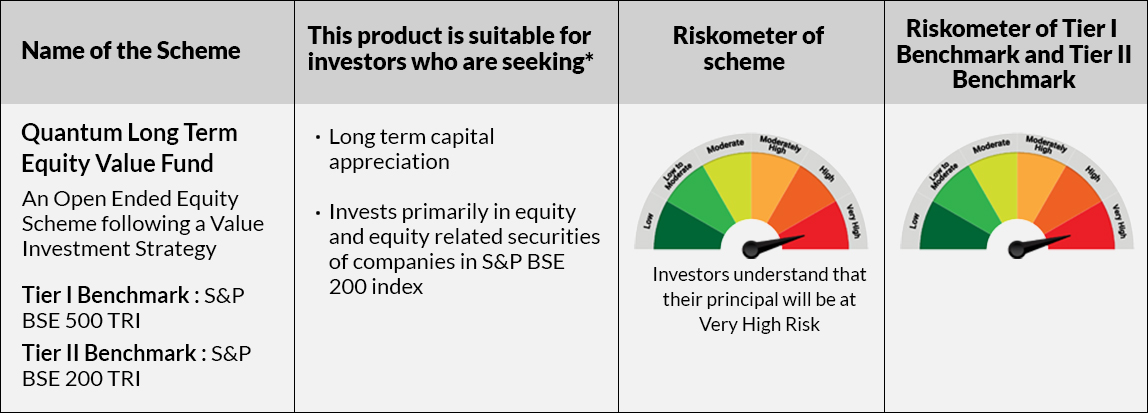
*Investors should consult their financial advisers if in doubt about whether the product is suitable for them.
Disclaimer, Statutory Details & Risk Factors:The views expressed here in this article / video are for general information and reading purpose only and do not constitute any guidelines and recommendations on any course of action to be followed by the reader. Quantum AMC / Quantum Mutual Fund is not guaranteeing / offering / communicating any indicative yield on investments made in the scheme(s). The views are not meant to serve as a professional guide / investment advice / intended to be an offer or solicitation for the purchase or sale of any financial product or instrument or mutual fund units for the reader. The article has been prepared on the basis of publicly available information, internally developed data and other sources believed to be reliable. Whilst no action has been solicited based upon the information provided herein, due care has been taken to ensure that the facts are accurate and views given are fair and reasonable as on date. Readers of this article should rely on information/data arising out of their own investigations and advised to seek independent professional advice and arrive at an informed decision before making any investments. Mutual Fund investments are subject to market risks read all scheme related documents carefully. |

Posted On Wednesday, Apr 16, 2025
Navigating the fast-paced investing world is like driving on a bustling highway—without risk mitigation strategies, you're as vulnerable as a driver speeding on a highway without a seat belt.
Read More
Posted On Tuesday, Apr 08, 2025
A new financial year is here—a clean slate, a fresh start, and a chance to get your investments in shape.
Read More
Posted On Tuesday, Apr 08, 2025
After five months of decline, Sensex ended March 2025 with + 5.7% returns.
Read MoreGet In Touch
Take small steps in your financial planning to achieve big dreams! Start your investment journey today!