Investment
₹
Posted On Friday, Mar 07, 2025

| Index | Performance (February 2025) |
| BSE Sensex | -5.5 |
| BSE Midcap Index | -10.4 |
| BSE Small cap | -13.7 |
| S&P 500 | -1.3 |
| MSCI Emerging Markets Index | 0.5 |
| Sectoral Performance | |
| BSE Healthcare | -8.5 |
| BSE Auto | -10.9 |
| BSE Information Technology | -12.6 |
| BSE FMCG | -10.0 |
| BSE Bankex | -2.5 |
| BSE Capital Goods | -14.3 |
| BSE Metal | -1.9 |
Data source: Bloomberg
Past performance may or may not be sustained in the future
Indian markets continued the down trend in the month of February 25 on the back of continued FPI (Foreign Portfolio Investor) selling (USD - 4 Bn (outflow) in February 25 on back of USD - 9 Bn (outflow) in January 25, $124 mn in CY24). Moderation in domestic consumption and likely impact of a potential tariff war weighed on equity markets. BSE Small Cap and BSE Mid Cap indices continue to relatively underperform the broader market with a return of -10.4% (Negative) and -13.7% (Negative) respectively. Large Cap oriented BSE Sensex Index recorded a return of -5.5% (Negative). Globally, S&P 500 and Dow Jones outperformed the BSE Sensex driven by expectation of better prospects for domestic US companies on the back of favourable policies by Trump administration. MSCI EM Index increased by 0.5% and Hongkong’s Hanseng Index (representative of China) increased by 16% during the month. China has seen a revival in interest following the rise of Deepseek (China based open source Large Language Model), earnings growth in select companies and relatively cheaper valuations.
Domestic economy has seen a moderation in inflation aided by softer vegetable prices. RBI has commenced the rate cutting cycle with a repo rate cut of 25 basis points. Indicators like GST collection and auto sales point to softness in the economy. Though there is no visible sign of a revival in consumption, rate cuts and a moderation in inflation could support the economy in medium term.
The key watch point from a global market perspective is the ongoing tariff war. US intends to implement reciprocal tariff which could potentially match tariff rates imposed by trading partners on imports from United States. US has recently announced tariffs on Mexico, Canada and China. Few of them have responded by announcing counter tariffs. The plausible after effect of tariffs would be an increase in inflation translating to a deferral of global rate cuts. Businesses are unlikely to announce investments as durability of tariffs are not clear.
US trade deficit with India stood at $45bn in CY24. (5% of total US trade deficit $918bn). As per 2023 WTO data, India imposes ~11% trade-weighted tariff on goods and services imported from US, while it faces 2.8% tariff on exports made to US. Among key sectors, tariff differential for pharma and chemicals are moderate at 9-10 percentage points. The impact on exports is likely to be low since the cost advantage offered by Indian exports are much larger than the potential tariff. IT sector is unlikely to have a material impact as US has not indicated the likelihood of tariff on service exports.
Quantum Long Term Equity Value Fund (QLTEVF) saw a decline of -6.2% (Negative) in its NAV in the month of February 2025; Tier-I benchmark BSE 500 TRI and Tier-II Benchmark BSE 200 TRI declined by -7.7% and -7.1% respectively. Our performance for the month was helped by absence of holdings in the expensive Industrial sector and relatively higher cash levels in a declining market. Relatively superior performance from private sector banks supported the relative outperformance.
With the recent correction, we have incrementally added to names where upside has turned favorable. We have added to existing names in utilities, two-wheeler, IT services, Asset Management and health insurance sectors. Cash in the scheme at the end of the month stood at 12.2% Vs 14.5% in the previous month.
A famous quote from the legendary investor Warren Buffett says: “Only when the tide goes out do you learn who has been swimming naked.” Last few months could be a quick test of robustness of thelong-term portfolio strategy. A good measure of portfolio behavior during market downturns could be the downside capture ratio. Downside capture indicates the ratio of fund’s performance as a proportion of market performance during down markets. Downside capture ratio lower than 100% indicates that the fund doesn’t fall as much as the index when the market corrects. Similarly, Upside capture indicates the fund’s performance as a proportion of market performance during up markets. A fund which has upside capture ratio higher than downside capture ratio generally does well in the long run, relative to it’s benchmark. It means that the fund captures a larger share when market goes up Vs how much it loses in a falling market.
The following graph shows the upside and downside capture ratios of Quantum Long Term Equity Value Fund (QLTEVF) relative to it’s Tier 1 benchmark – BSE 500 Total Return Index. As can be seen in the graph, QLTEVF has generally fared well in down markets. Lower downside capture ratio is a result of cash raised by selling overvalued shares during tail end of the bull markets. A portfolio with stocks which are cheaper relative to broader markets also helps during market down turns. Lower downside capture grants more capital to be deployed for the next up cycle, granting a lead for the long haul. Lower downside capture along with reasonable performance during bull markets keeps it in good stead over the long term.
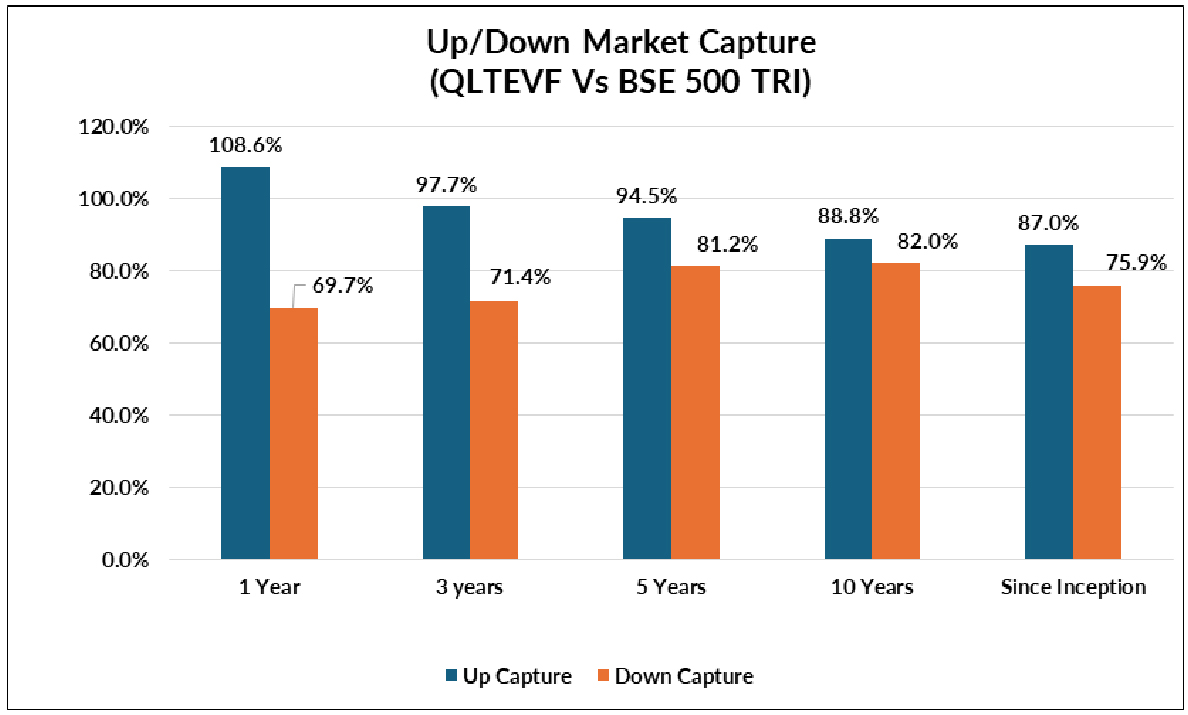
Source: Quantum, Data as of 28-Feb-2025 Past performance may or may not be sustained in the future. Since Inception Date (Direct Plan): QLTEVF (March 13, 2006)
The following chart shows the profit share and market cap share of Large Cap (BSE 100 index) as a proportion of broader universe (BSE 500 index). As can be seen in the chart, profit share of large cap is towards the higher end of historic range. At the same time, Market cap share of large caps has drifted towards the lower end of historic range. The combination points to relative attractiveness of large cap universe. Quantum Long Term Equity Value Fund (QLTEVF) has a large cap tilt due to it’s thrust on portfolio liquidity. The reduction in cash during the recent month is a result of opportunities emerging with reasonable upside. Considering the recent correction and the current market setup, there is a reasonable chance in emergence of new ideas with threshold upside potential. Investors may utilize current times to fortify the base of equity block with lumpsum allocations to QLTEVF.
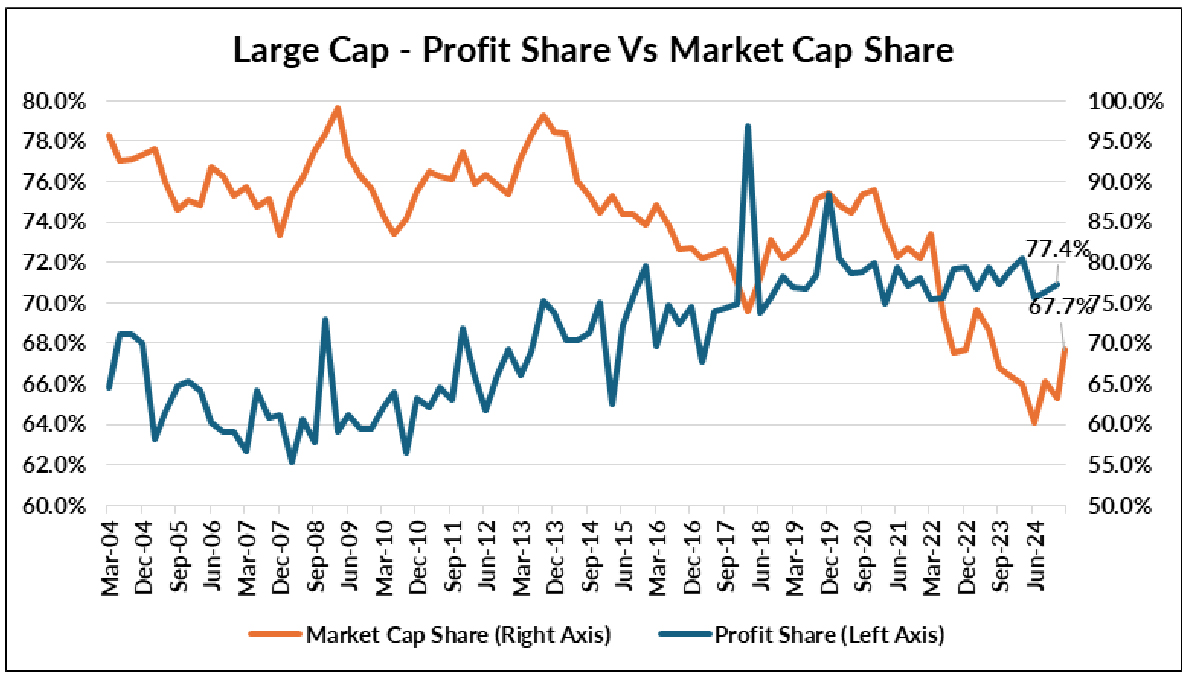
Source: Ace Equity; Data as of 28-Feb-2025; Share of BSE 100 index out of BSE 500 is taken for Large Cap share; Prior 8 quarter average is considered for profit share in few quarters where the reading was not meaningful (Applicable Quarters: Mar-2019, Sep -2019, Mar -2020, June-2020).
Source: Bloomberg, World Trade Organization (WTO)
 |
Name of the Scheme | This product is suitable for investors who are seeking* | Scheme Riskometer | Benchmark Riskometer (Tier I) - BSE 500 TRI & (Tier II) - BSE 200 TRI |
Quantum Long Term Equity Value Fund An Open Ended Equity Scheme following a Value Investment Strategy. | • Long term capital appreciation • Invests primarily in equity and equity related securities of companies in BSE 200 index | 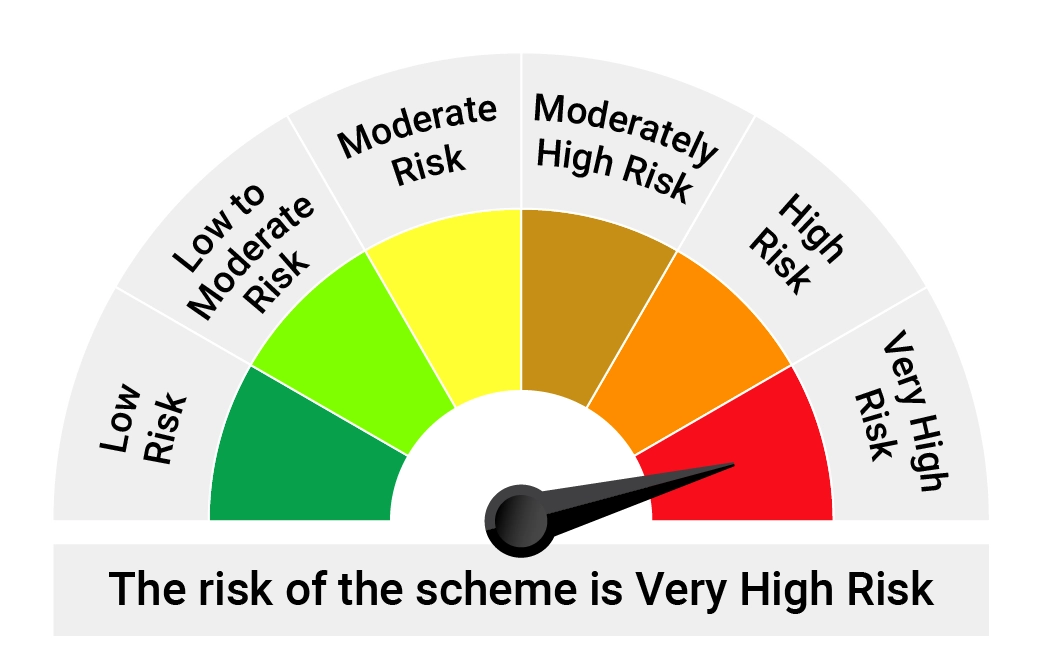 |  |
*Investors should consult their financial advisers if in doubt about whether the product is suitable for them.
Disclaimer, Statutory Details & Risk Factors:The views expressed here in this article / video are for general information and reading purpose only and do not constitute any guidelines and recommendations on any course of action to be followed by the reader. Quantum AMC / Quantum Mutual Fund is not guaranteeing / offering / communicating any indicative yield on investments made in the scheme(s). The views are not meant to serve as a professional guide / investment advice / intended to be an offer or solicitation for the purchase or sale of any financial product or instrument or mutual fund units for the reader. The article has been prepared on the basis of publicly available information, internally developed data and other sources believed to be reliable. Whilst no action has been solicited based upon the information provided herein, due care has been taken to ensure that the facts are accurate and views given are fair and reasonable as on date. Readers of this article should rely on information/data arising out of their own investigations and advised to seek independent professional advice and arrive at an informed decision before making any investments. Mutual Fund investments are subject to market risks, read all scheme related documents carefully. |

Posted On Tuesday, Apr 08, 2025
After five months of decline, Sensex ended March 2025 with + 5.7% returns.
Read More
Posted On Friday, Mar 07, 2025
Indian markets continued the down trend in the month of February 25 on the back of continued FPI
Read More
Posted On Thursday, Feb 06, 2025
Indian markets witnessed sharp sell-off in the month of January on the back of continued FII selling (USD -8.6Bn in January 25 vs USD -755Mn for CY2024).
Read MoreGet In Touch
Take small steps in your financial planning to achieve big dreams! Start your investment journey today!