US Rate Cut from Indian Lens - A historical Perspective
Posted On Friday, Sep 20, 2024
Amidst cooling inflation and slowing economic activity, central banks around the world (with few exceptions) are heading for a synchronized monetary easing cycle. Among advanced economies (AEs), Swiss National Bank (SNB) kicked off the rate cutting cycle first in March 2024. Subsequently, other major central banks – European Central Bank (ECB), Bank of England (BOE), and Bank of Canada (BOC) and Sweden's Rosebank also started their rate easing cycles.
The US FED has now joined the expanding list of central banks that have slashed interest rates, having done so on September 18th with a 50 basis point reduction in federal funds rate.
The lone exception in this group is Bank of Japan (BOJ), which has hiked interest rates twice already in 2024 and is predicted to do so again, going against the general trend. Notwithstanding, global monetary easing is expected to intensify going forward.
Chart – I: With Inflation easing, a synchronized global rate cutting cycle taking hold
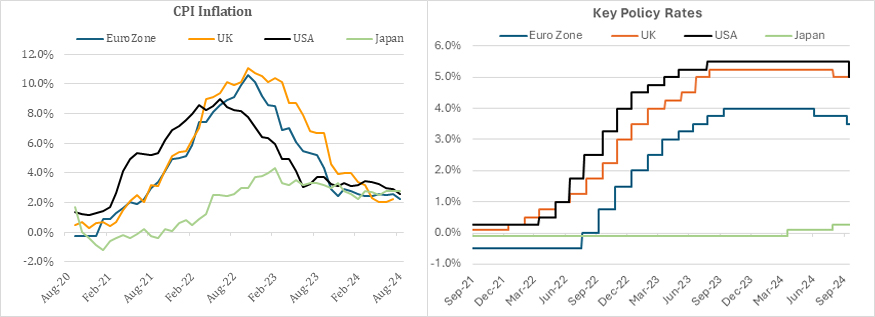
Source: Refinitiv, Quantum Research, Data updated upto September 18, 2024
FED’s Jumbo Cut
The US Fed cut interest rates by 50 basis points to start its rate cutting cycle. The Federal Funds target rate range now stands at 4.75%-5.00% from earlier 5.25%-5.50%.
The rate cut decision was guided by the FOMC’s (Federal Open Market Committee) growing confidence that inflation is moving sustainably toward its 2% goal and that the labor market has cooled from its formerly overheated state.
Fed Chair Jerome Powell remarked, “Our economy is strong overall… and…the risks to achieving its employment and inflation goals are roughly in balance.” He also reiterated that the Fed's main focus now is to keep a lid on the unemployment rate.
Before the FOMC meeting, there were chatters of a more than 25 basis points rate cut, but neither we nor many other market participants felt that the Fed would actually implement them. To that extent there was a positive surprise.
However, the larger 50 bps cut seems to have a catch-up element as the decision was guided by softer jobs and CPI data in July which came few days after the July FOMC meeting. Given the Fed’s assessment of the job situation and general prognosis for the US economy, we would expect future rate cuts to be gradual 25 basis points in coming months.
The FOMC also updated the Summary of Economic Projections (SEP) which carries some crucial insights about the future rate path:
- The “dot plot” (which represents a committee members’ forecast for the federal funds rate) indicates an additional 50-bps rate cut in 2024 and a further 100 bps cut in 2025, reflecting a continued easing of monetary policy.
- Although median FOMC member now calls for an additional 50 bps of rate cuts for the remainder of 2024, nine out of 19 members projected just 25 bps cut before the year end. Thus, uncertainty around the path of policy easing might persist.
- The median estimate of longer run dot plot ticked higher to 2.9% suggesting more FOMC members now believe that the long-term neutral policy rates may have increased compared to pre-pandemic levels – setting higher floor on the Federal Funds rate.
Chart -II: FED rate Cutting Cycle to continue well into 2025
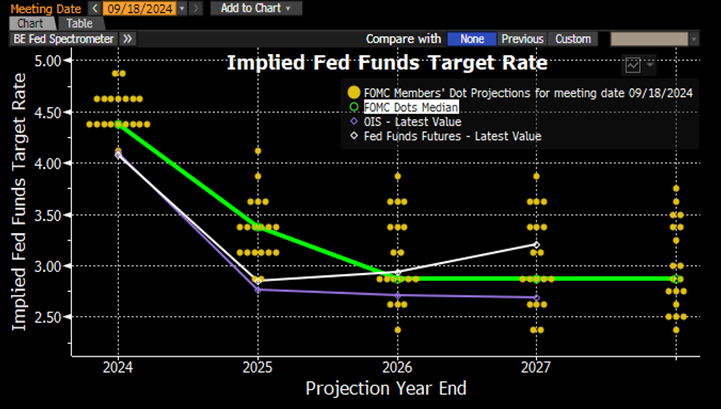
Source: Bloomberg, As of September 18, 2024
What does it mean for India?
To deepen our understanding, we analyzed India’s historical linkages to the previous FED rate cutting cycles. In the last 25 years, there have been three major rate cutting cycles in the US – between 2000-03, 2007-08 and 2019-20. Each of these rate cutting cycles either started in response to a crisis or in anticipation of one. In this regard, the current rate cutting cycle looks different as there is no sight of any such crisis at this point.
The chart below illustrates three distinct periods during which the Federal Reserve reduced interest rates. We will now analyze the corresponding reactions of India’s Repo rates, bond yields, and currency during each of these phases.
Chart III: Historical Trends in Fed Fund Rates and RBI Repo Rates
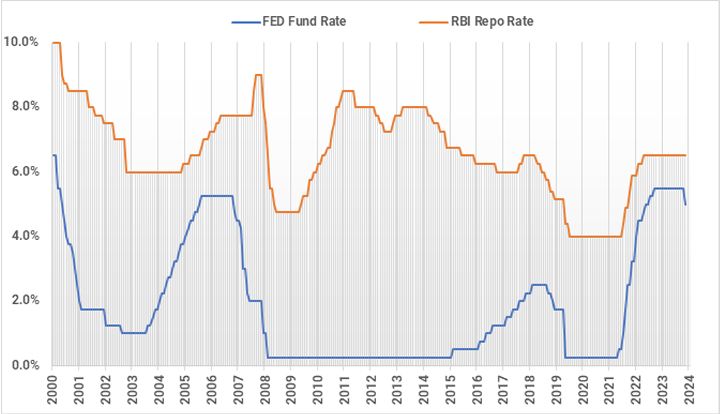
Source: Bloomberg, Quantum Research, Data updated till September 19, 2024
Phase 1: December 2000 to December 2003
This period captures the economic adjustments following the dot-com bubble burst and the 9/11 attacks, with central banks cutting rates to support economies, bond yields reflecting changing risk perceptions, and significant currency movements.
Table - I: FED Rate Cuts - 2000 to 2003
| Dec-00 | 1-Dec | 2-Dec | 3-Dec | Cumulative (Dec 00-Dec 03) | |
| FED Fund Rate* | 6.50% | 1.75% | 1.25% | 1.00% | -550 bps |
| RBI Repo | 10.00% | 8.50% | 7.50% | 6.00% | -400 bps |
| 10 Year US Treasury Yield | 5.11% | 5.05% | 3.82% | 4.25% | -87 bps |
| 10yr Indian Govt. Bond Yield | 10.88% | 7.94% | 6.08% | 5.12% | -576 bps |
| Dollar Index | 109.56 | 116.75 | 101.85 | 86.92 | -20.70% |
| INR/USD** | 46.68 | 48.25 | 47.98 | 45.63 | 2.30% |
Source: Bloomberg, Quantum Research
*Upper Band for Fed Fund Rates; ** Positive % change shows appreciation in INR and vice versa.
During this period, the US FED cut rates by 550 basis points. The RBI too lowered the repo rate by 400 basis points though it came with some lag.
The 10-year U.S. Treasury yield initially decreased, reflecting lower growth expectations and a flight to safety. Despite India’s more gradual rate cuts, Indian government bond (IGB) yields dropped significantly more than those in the US.
The Dollar index first appreciated 6.6% during 2001 and then depreciated sharply during 2002 and 2003. On cumulative basis between Dec-2000 and Dec-2003, the dollar index depreciated by over 20%. Despite a sharp depreciation in Dollar, the Indian rupee gained only 2.3% during this period.
Phase 2: August 2007 to April 2009
This period captures the global financial crisis’s impact, with central banks cutting rates to stimulate economies, bond yields falling due to risk aversion, and significant currency movements reflecting economic uncertainties.
Table - II: FED Rate Cuts - 2007 to 2008
| Aug-07 | Aug-08 | Dec-08 | Apr-09 | Cumulative (Aug 07-Apr 09) | |
| FED Fund Rate* | 5.25% | 2.00% | 0.25% | 0.25% | -500 bps |
| RBI Repo | 7.75% | 9.00% | 6.50% | 4.75% | -300 bps |
| 10 Year US Treasury Yield | 4.53% | 3.81% | 2.21% | 3.12% | -141 bps |
| 10yr Indian Govt. Bond Yield | 7.93% | 8.70% | 5.26% | 6.24% | -169 bps |
| Dollar Index | 80.79 | 77.38 | 81.31 | 84.61 | 4.7% |
| INR/USD | 40.9 | 43.95 | 48.8 | 50.09 | -22.50% |
Source: Bloomberg, Quantum Research
*Upper Band for Fed Fund Rates; ** Positive % change shows appreciation in INR and vice versa.
The FED Fund Rate sharply declined due to the Federal Reserve’s aggressive monetary easing during the financial crisis. Similarly, India’s Repo Rate followed an easing trend, though with initial tightening and a delay. The US began rate cuts in August 2007, while India increased rates in May 2008 and only started reducing them after September 2009.
Indian government bonds and US treasuries depicted divergent behavior during the initial fed rate cuts between Aug-07 and Aug-08. During this period US treasury yields declined sharply while Indian bond yields moved up. However, this corrected during the later phase when Indian government bond yields fell by massive 344 bps between in August and December 2008.
After some initial decline, the Dollar Index rose as the crisis spread, reflecting a flight to the US dollar as a safe haven. While the INR depreciated cumulative 22.5% during this phase due to capital outflows and heightened risk perception on emerging economies.
Phase 3: June 2019 to March 2020
This period reflects the global economic response to the COVID-19 pandemic, marked by substantial monetary easing, a shift towards safe assets, and currency fluctuations driven by economic uncertainties. Compared to previous cycles, this rate-cutting phase was smaller in magnitude.
Table – III: FED Rate Cuts - 2019 to 2020
| Dec-18 | Jun-19 | Feb-20 | Jun-20 | Cumulative (Aug 07-Apr 09) | |
| FED Fund Rate* | 2.50% | 2.50% | 1.75% | 0.25% | -225 bps |
| RBI Repo | 6.50% | 5.75% | 5.15% | 4.00% | -250 bps |
| 10 Year US Treasury Yield | 2.68% | 2.01% | 1.15% | 0.66% | -203 bps |
| 10yr Indian Govt. Bond Yield | 7.37% | 6.88% | 6.37% | 5.89% | -148 bps |
| Dollar Index | 96.17 | 96.13 | 98.13 | 97.39 | 1.3% |
| INR/USD | 69.77 | 69.03 | 72.18 | 75.51 | -8.20% |
Source: Bloomberg, Quantum Research
*Upper Band for Fed Fund Rates; ** Positive % change shows appreciation in INR and vice versa.
The rate cutting cycle started well before the Covid-19 pandemic as both the US and India started cutting interest rates in 2019 in response to deteriorating economic conditions. In this phase, India started the rate cutting cycle before the Fed as credit crunch post IL&FS burst hit the economy.
Bond yields in both countries fell, in response to the monetary easing, though US bond yields declined more sharply than IGB yields.
The US Dollar Index showed slight appreciation, while the Indian Rupee depreciated around 8.2%.
Conclusion
Although India’s rate cycles have generally mirrored that of the US in direction and magnitude, there has been noticeable lags in its implementation. Timing and extent of rate moves in India are influenced more by domestic factors though global influences are also significant.
Indian bond yields followed the domestic and US monetary policy in all the past cycle though with varying proportion and lags. For Indian Rupee, there is no clear relation with the Fed policy.
What lies ahead for Indian Bonds?
The RBI Governor, on many occasions, has guided that the RBI’s rate decisions will be dependent on the domestic growth and inflation dynamics and will not just follow the FED.
Given the domestic inflation has been coming down, the RBI is expected to cut rates in near future. However, the timing and quantum of rate cut will depend on domestic fundamentals.
We expect the domestic rate cutting cycle to be shorter and sallower than what is expected in the US. If current inflation trend sustains, the RBI might start cutting rates from February 2025 and lower the policy repo rate by cumulative 50-100 basis points in 2025.
Chart IV: CPI Trending Down; Core-CPI well below the RBI’s 4% target
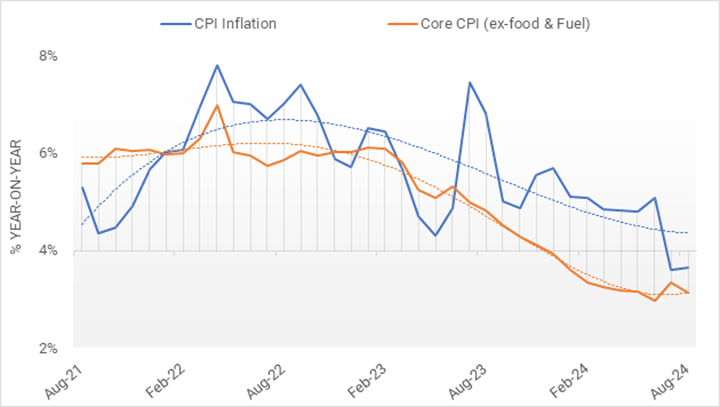
Source: MOSPI, RBI, Quantum Research. Data updated till August 2024
Lower rates in developed economies should drive capital flows into emerging markets. With India getting included in global bond portfolios, foreign inflows into the Indian bond market could increase substantially in 2025.
We continue to hold our medium term positive outlook on Indian bonds (refer The Bull Case andGetting Better) which is supported by a structural shift in demand supply balance, and a cyclical turn in inflation and monetary policy.
What should Investors do?
Considering a strong case for long term yields to decline over the next 1-2 years, we believe long term government bonds offer a rewarding opportunity.
Dynamic Bond Funds are well-positioned to capitalize on this opportunity, offering the flexibility to adjust if circumstances change. However, investors should be prepared for a holding period of at least 2-3 years to navigate through potential volatility.
Investors with shorter investment horizons and low-risk appetites should stick with liquid funds.
Portfolio Positioning
Scheme Name | Investment Approach |
The scheme invests in debt securities of up to 91 days of maturity issued by the government and selected public sector companies. | |
The scheme to invest in debt securities issued by the government and selected public sector companies. The scheme follows an active duration management strategy and increases/decreases the portfolio duration (sensitivity to interest rates changes) in accordance with the Interest Rate Outlook. Reflecting our positive view on long term bonds, the QDBF portfolio has reasonably high allocation to long term government bonds with maturities above 10 years. |
For any queries directly linked to the insights and data shared in the newsletter, please reach out to the author – Pankaj Pathak, Fund Manager – Fixed Income at [email protected].
For all other queries, please contact Neeraj Kotian – Area Manager, Quantum AMC at [email protected] / [email protected] or call him on Tel: 9833289034
Read our last few Debt Market Observer write-ups -
- Market Mood – Optimism and Resilience
Name of the Scheme | This product is suitable for investors who are seeking* | Riskometer of Scheme | Riskometer of Tier I Benchmark |
Quantum Liquid Fund An Open-ended Liquid Scheme. A relatively low interest rate risk and relatively low credit risk. |
| 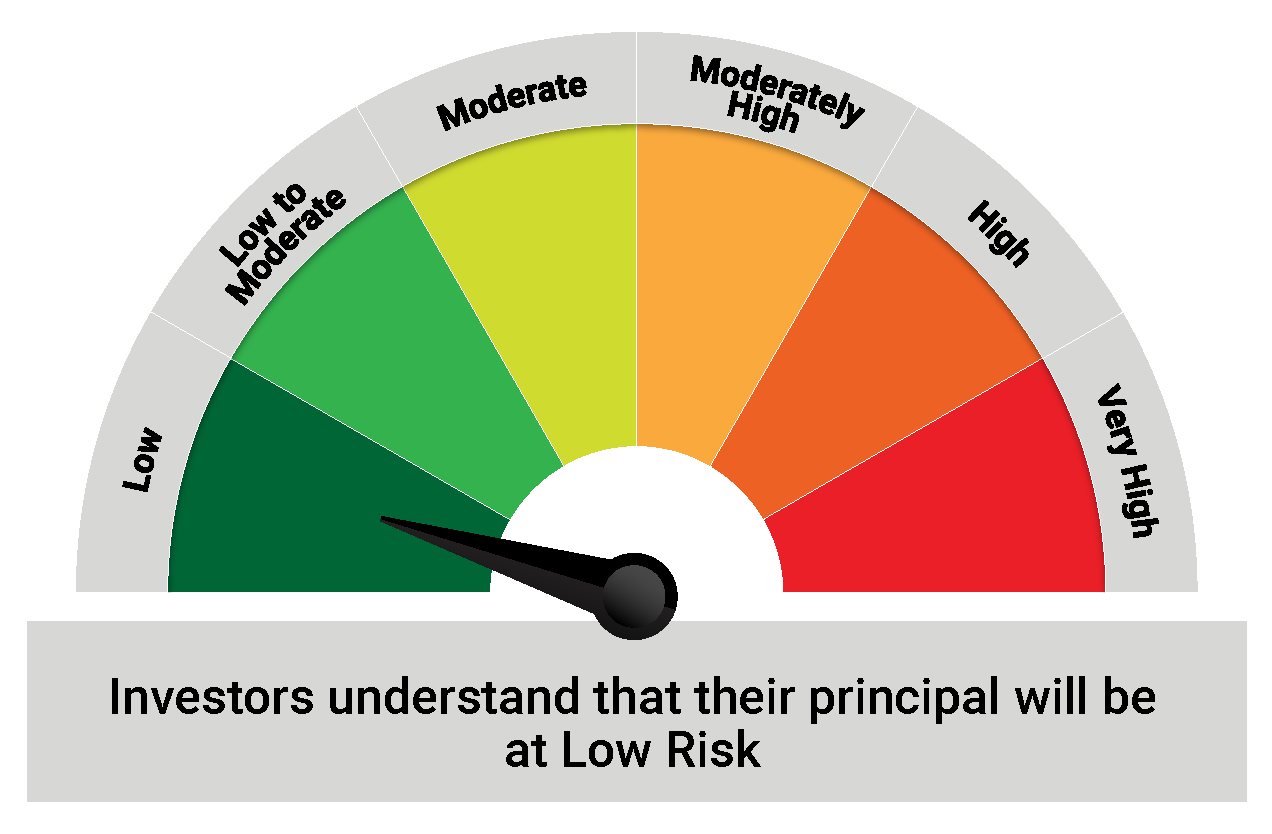 | 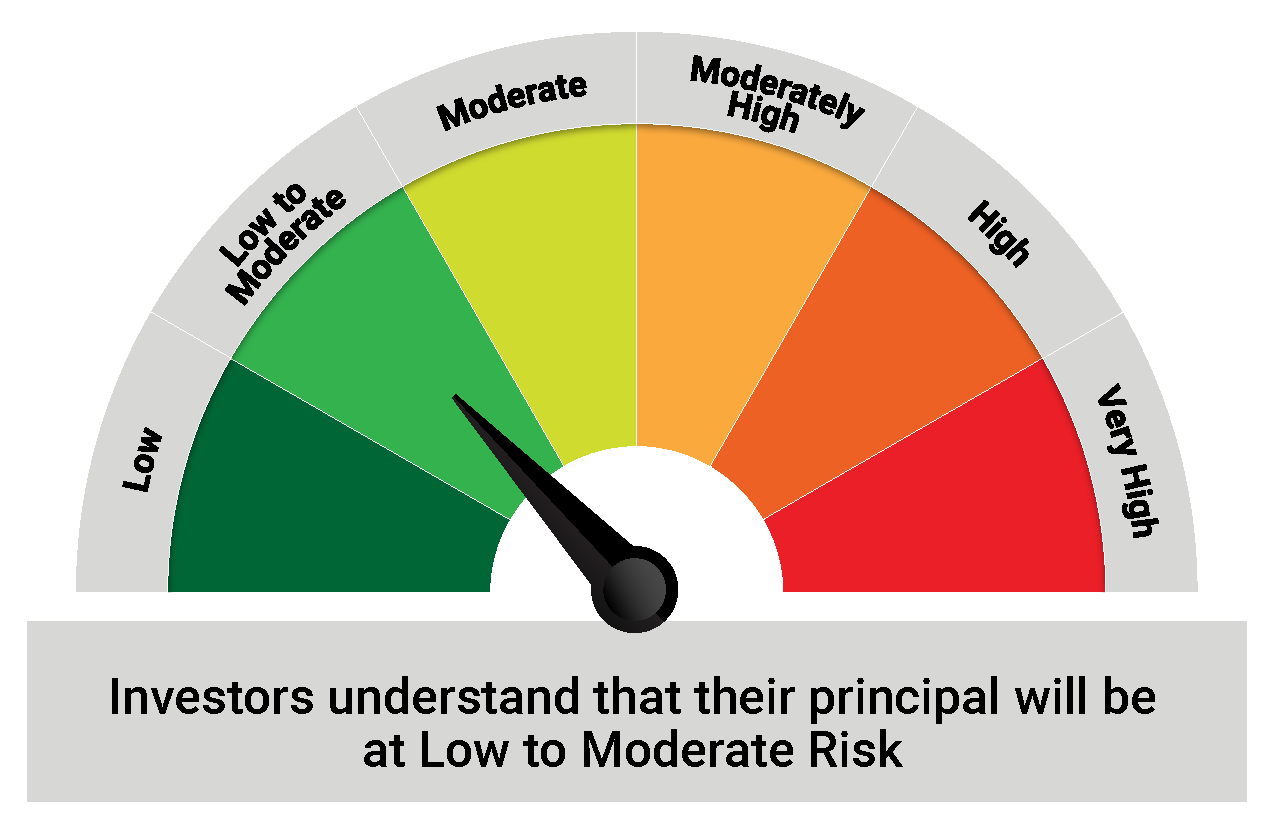 |
Quantum Dynamic Bond Fund An Open-ended Dynamic Debt Scheme Investing Across Duration. A relatively high interest rate risk and relatively low credit risk. |
| 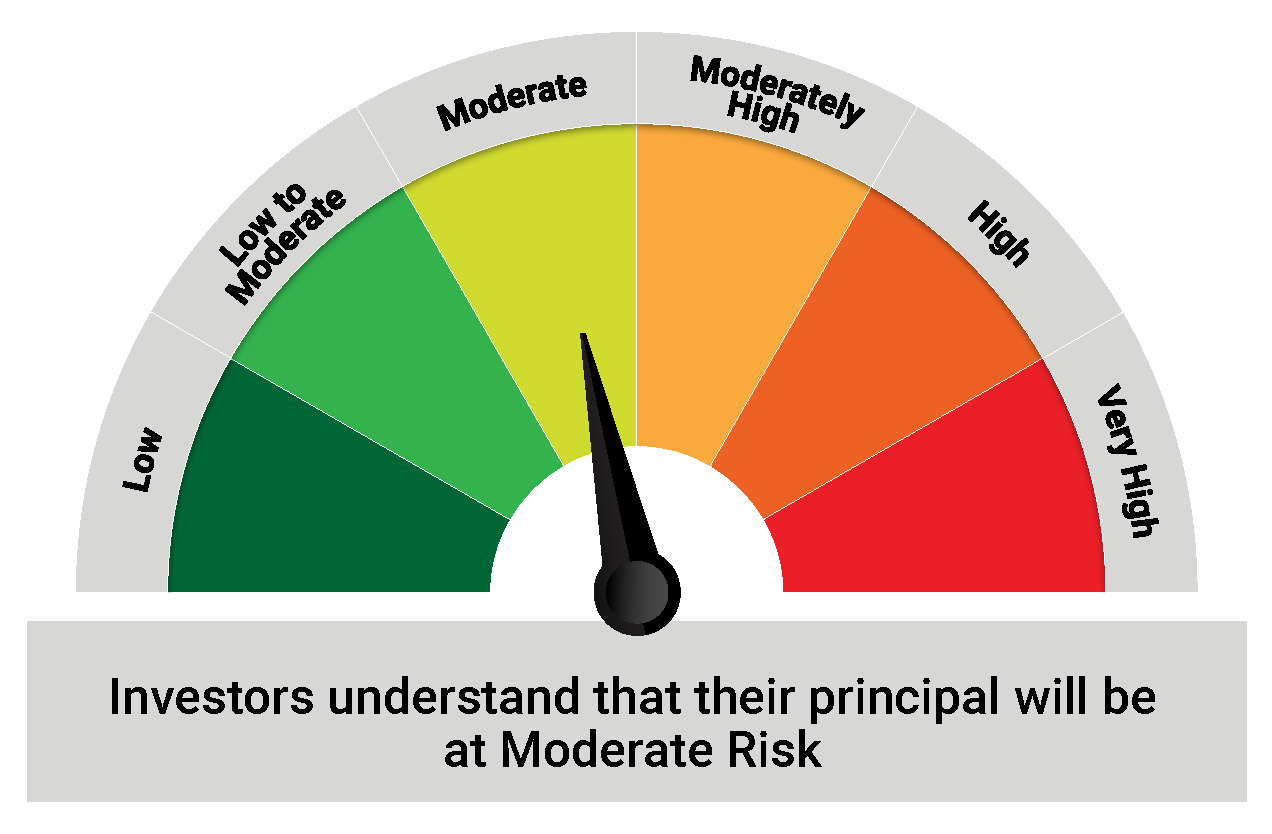 | |
*Investors should consult their financial advisers if in doubt about whether the product is suitable for them.
| Potential Risk Class Matrix – Quantum Liquid Fund | |||
Credit Risk → | Relatively Low | Moderate (Class B) | Relatively High (Class C) |
Interest Rate Risk↓ | |||
| Relatively Low (Class I) | A-I | ||
| Moderate (Class II) | |||
| Relatively High (Class III) | |||
| Potential Risk Class Matrix – Quantum Dynamic Bond Fund | |||
Credit Risk → | Relatively Low | Moderate (Class B) | Relatively High (Class C) |
Interest Rate Risk↓ | |||
Relatively Low (Class I) | |||
| Moderate (Class II) | |||
| Relatively High (Class III) | A-III | ||
Disclaimer, Statutory Details & Risk Factors:The views expressed here in this article / video are for general information and reading purpose only and do not constitute any guidelines and recommendations on any course of action to be followed by the reader. Quantum AMC / Quantum Mutual Fund is not guaranteeing / offering / communicating any indicative yield on investments made in the scheme(s). The views are not meant to serve as a professional guide / investment advice / intended to be an offer or solicitation for the purchase or sale of any financial product or instrument or mutual fund units for the reader. The article has been prepared on the basis of publicly available information, internally developed data and other sources believed to be reliable. Whilst no action has been solicited based upon the information provided herein, due care has been taken to ensure that the facts are accurate and views given are fair and reasonable as on date. Readers of this article should rely on information/data arising out of their own investigations and advised to seek independent professional advice and arrive at an informed decision before making any investments. Mutual Fund investments are subject to market risks, read all scheme related documents carefully. |
Related Posts
-

Looking Beyond the 10-Year Benchmark: Decoding India’s Bond Market Signals
Posted On Thursday, Feb 26, 2026
If you glance at India’s financial headlines today, the tone feels reassuring.
Read More -
Positioning for Disinflation
Posted On Friday, Jan 27, 2023
We are well past the peak inflation of 2022. Yet, inflation continues to be the focal point of all the policy discussions and investment thesis in 2023.
Read More -
Fixed Income - Year End Wrap Up & Outlook 2023
Posted On Thursday, Dec 22, 2022
2022 started with a hope of normalcy after two back-to-back years of dealing with the Covid-19 pandemic.
Read More